Fig. C.2.
Download original image
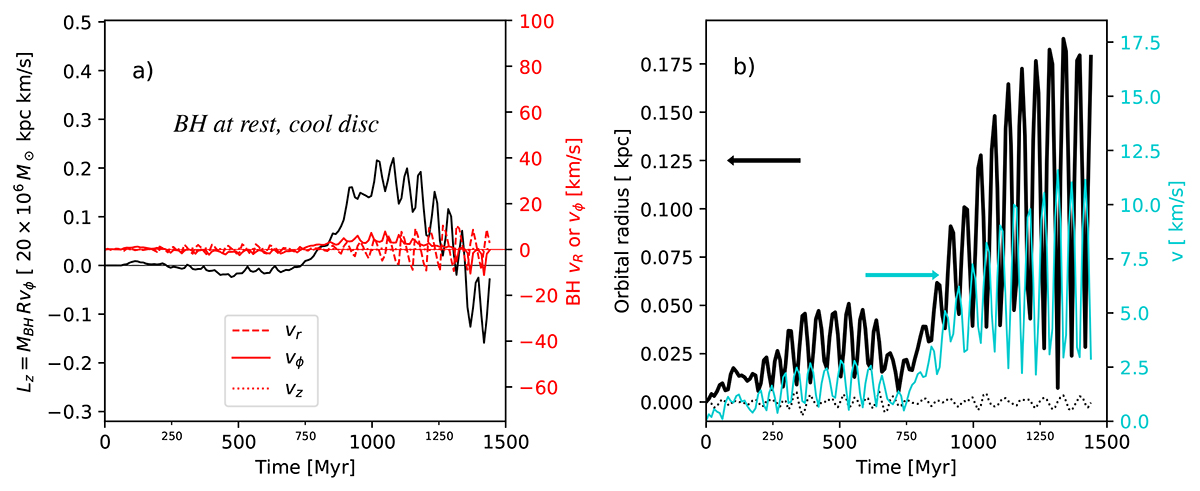
Time evolution of the velocity, position and angular momentum of the BH as function of time. The BH initially sits at rest at the system’s barycentre. a) The solid black curve graphs the angular momentum, which shows an irregular pattern of small amplitude; the scale’s upper bound of ≃0.5 is the value expected for a radial orbit with r = 0.125kpc at velocity vϕ = 6.6km s1 ; the right-hand axis in red is the scale for individual velocity components ; b) The radius (in black, left-hand axis) and velocity |v•| (in turquoise, right-hand axis) as function of time. The arrows indicate the spatial resolution =0.125kpc of the calculation, in black; and the expected velocity for a BH orbiting in the frozen background potential inside its influence radius, here ≃0.180kpc, in turquoise. The black dotted line is the z coordinate. Significant yet resolved motion develops only after a runtime ∼1.5 Gyr.
Current usage metrics show cumulative count of Article Views (full-text article views including HTML views, PDF and ePub downloads, according to the available data) and Abstracts Views on Vision4Press platform.
Data correspond to usage on the plateform after 2015. The current usage metrics is available 48-96 hours after online publication and is updated daily on week days.
Initial download of the metrics may take a while.