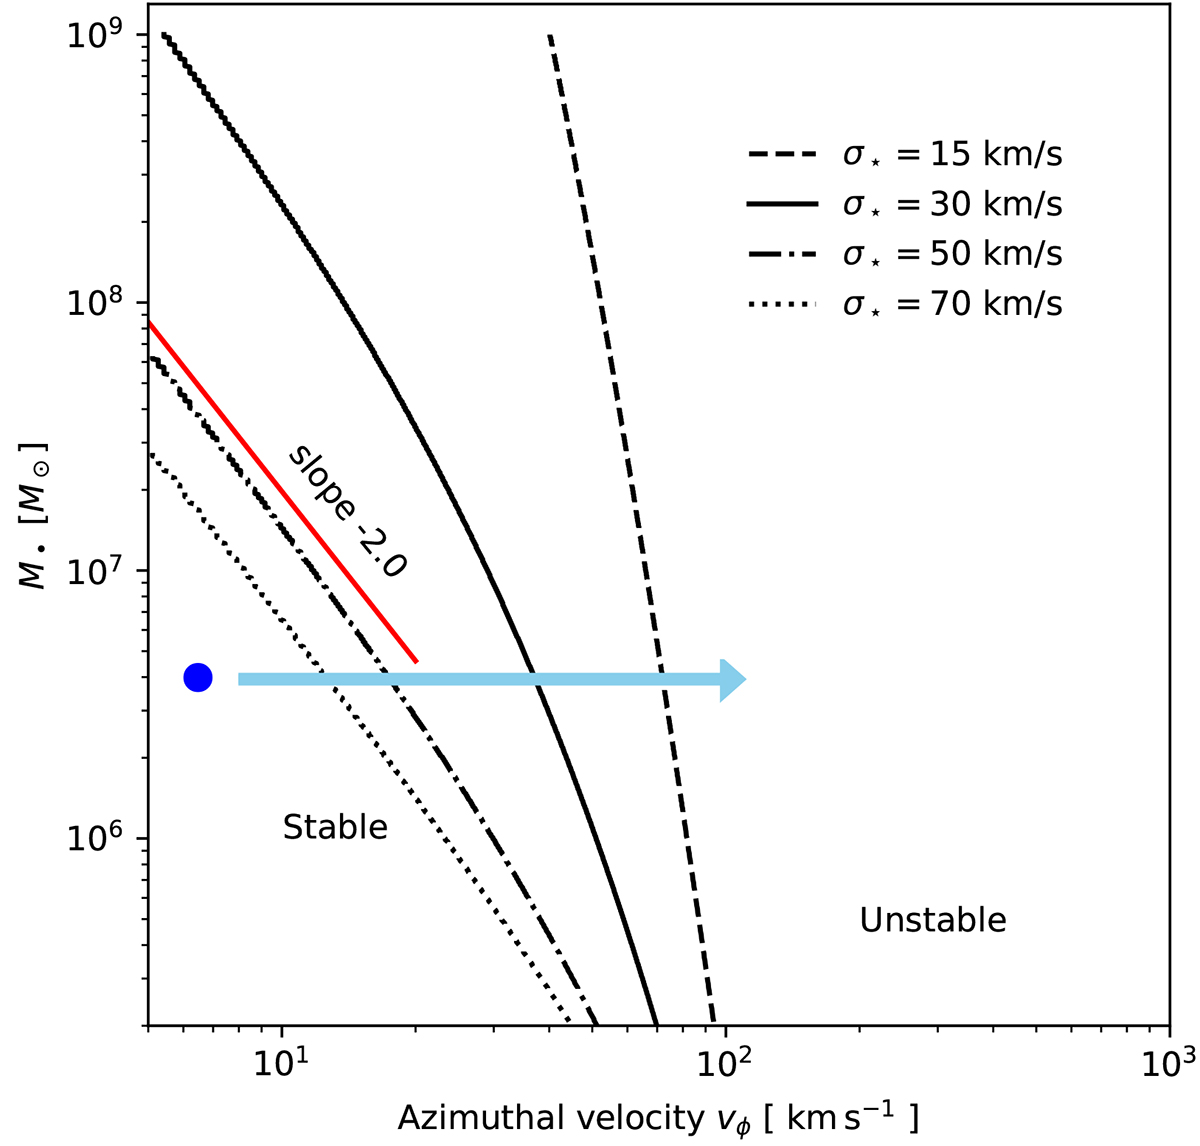
Fig. 4.
Download original image
Critical line of stability for various configurations. The vertical axis is the BH mass M• plotted against azimuthal velocity vϕ. At fixed M•, the minimum azimuthal velocity vϕ to reach such that the dynamical traction sets in is found by crossing one of the black curves, from left, to right. Four curves are plotted, each corresponding to a different value of the stellar velocity dispersion σ⋆ as indicated in the legend. The blue dot marks the estimated coordinates of the Milky Way’s BH. The red curve highlights an asymptotic trend of slop ≃ − 2 found in the limit of low vϕ.
Current usage metrics show cumulative count of Article Views (full-text article views including HTML views, PDF and ePub downloads, according to the available data) and Abstracts Views on Vision4Press platform.
Data correspond to usage on the plateform after 2015. The current usage metrics is available 48-96 hours after online publication and is updated daily on week days.
Initial download of the metrics may take a while.