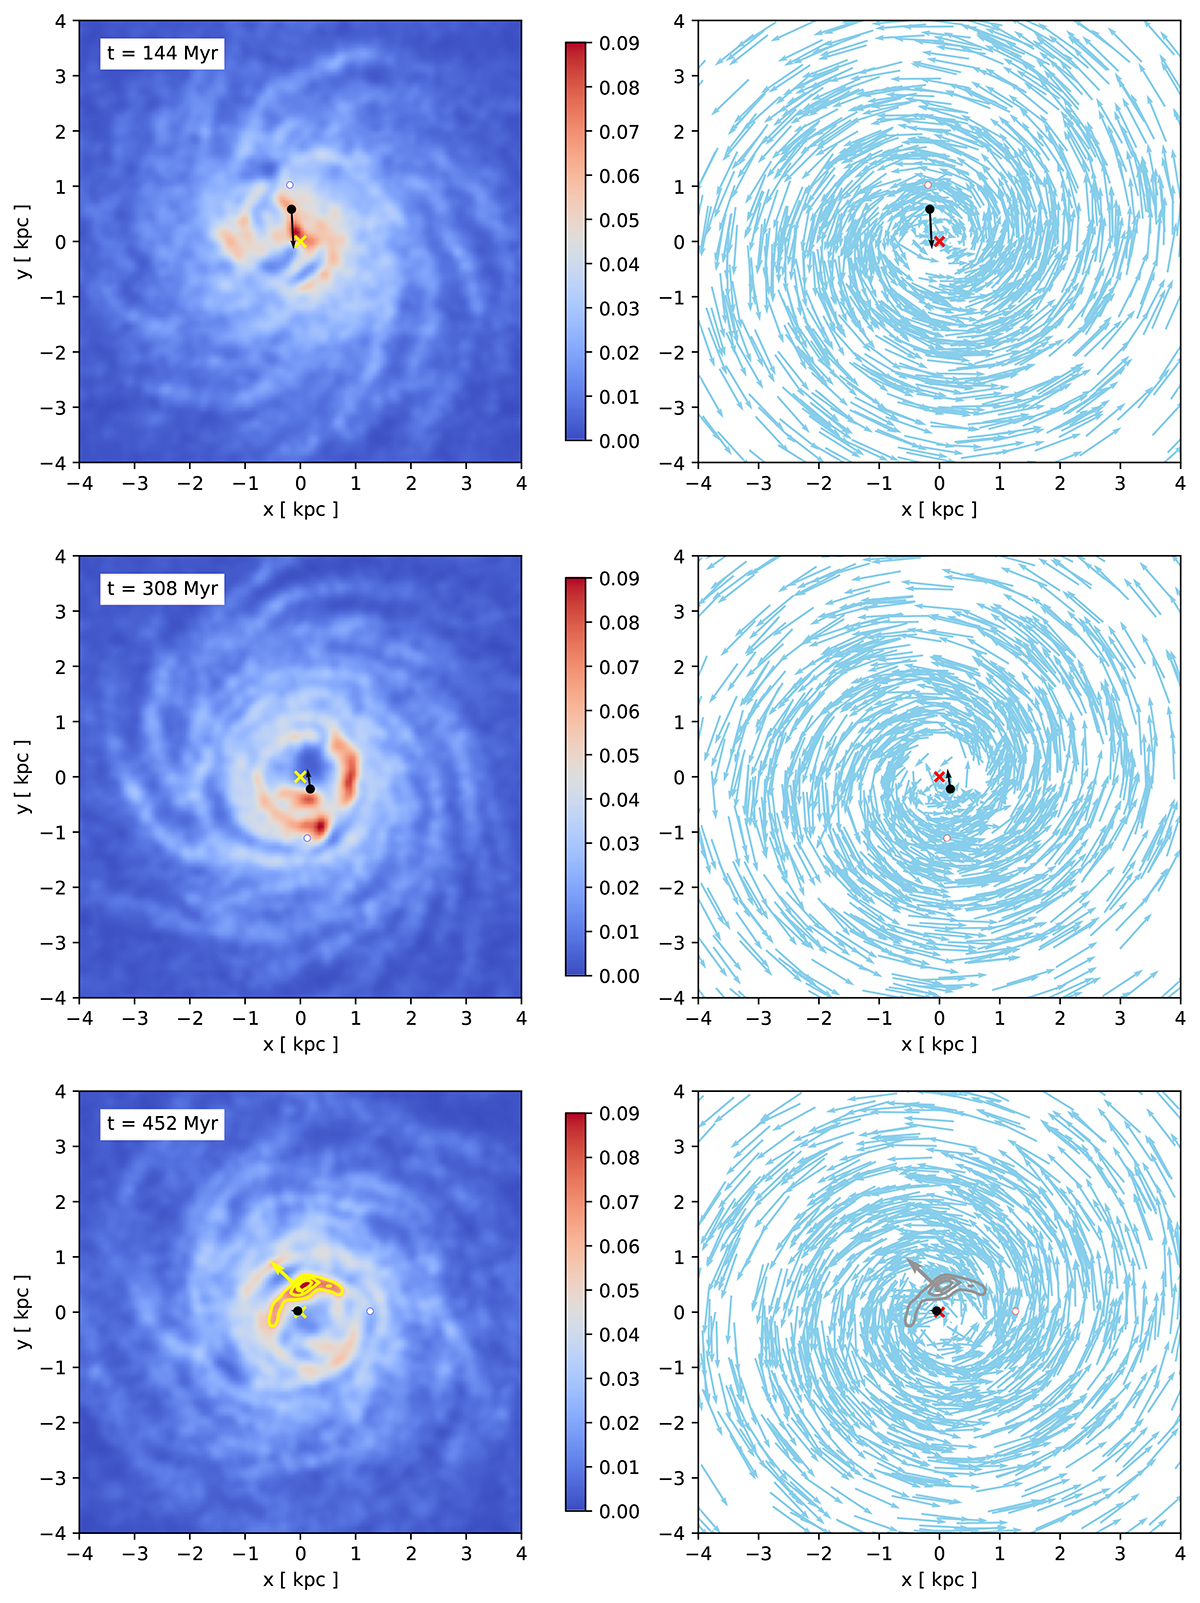
Fig. 8.
Download original image
Transition to a fragmented morphology for a galactic disc perturbed by a massive BH. Left-hand panels: Density map of stars with peaks indicated in red. Right-hand panels: Velocity field. A black dot indicates the BH of 1.25 × 10⁷ M⊙ (or, ≃1% the mass of the stars), with its velocity vector also in black. The configurations are displayed at three different times: 144 (top), 308 (middle), and 452 Myr (bottom row) of evolution. Contour levels in yellow (left-hand panel) and grey (right-hand panel) identify the member stars of the clump formed at t = 452 Myr. The BH sits at ≃52pc of the coordinates centre. The relative velocity between the clump’s centre of mass motion and the BH is indicated with an arrow on both panels, pointing in a north, north-west direction (west is to the left).
Current usage metrics show cumulative count of Article Views (full-text article views including HTML views, PDF and ePub downloads, according to the available data) and Abstracts Views on Vision4Press platform.
Data correspond to usage on the plateform after 2015. The current usage metrics is available 48-96 hours after online publication and is updated daily on week days.
Initial download of the metrics may take a while.