Fig. 9.
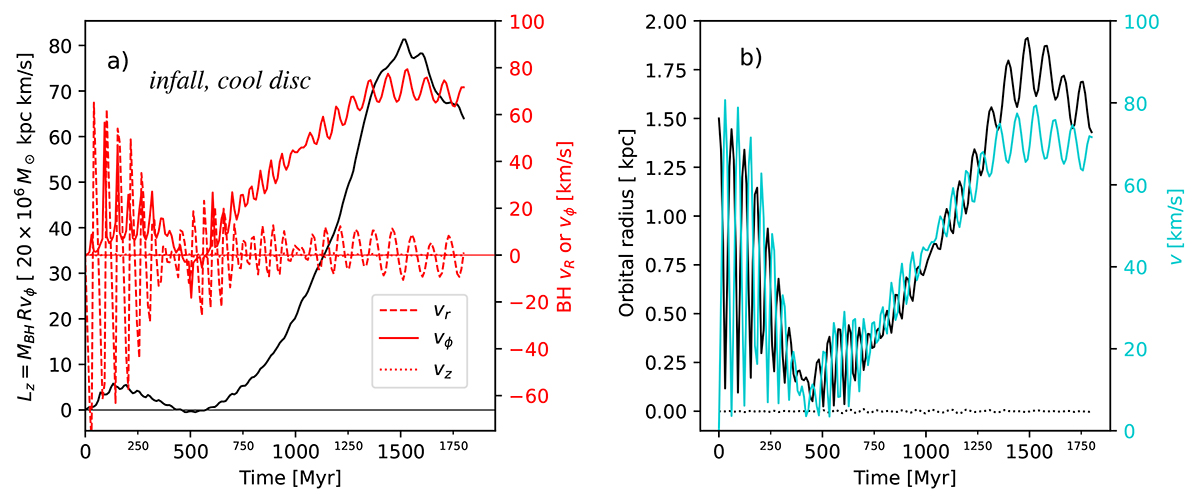
Download original image
Case of a BH falling from rest on a radial orbit. a) The solid black curve graphs the angular momentum accrued over time (left-hand axis with black labels); the right-hand axis is the scale for each velocity component (red curves). b) The cylindrical radius (in black, left-hand axis) and velocity (right-hand axis, in turquoise) are shown as a function of time. The dotted line at the bottom is the z coordinate bound to ±12pc.
Current usage metrics show cumulative count of Article Views (full-text article views including HTML views, PDF and ePub downloads, according to the available data) and Abstracts Views on Vision4Press platform.
Data correspond to usage on the plateform after 2015. The current usage metrics is available 48-96 hours after online publication and is updated daily on week days.
Initial download of the metrics may take a while.