Open Access
Fig. 10
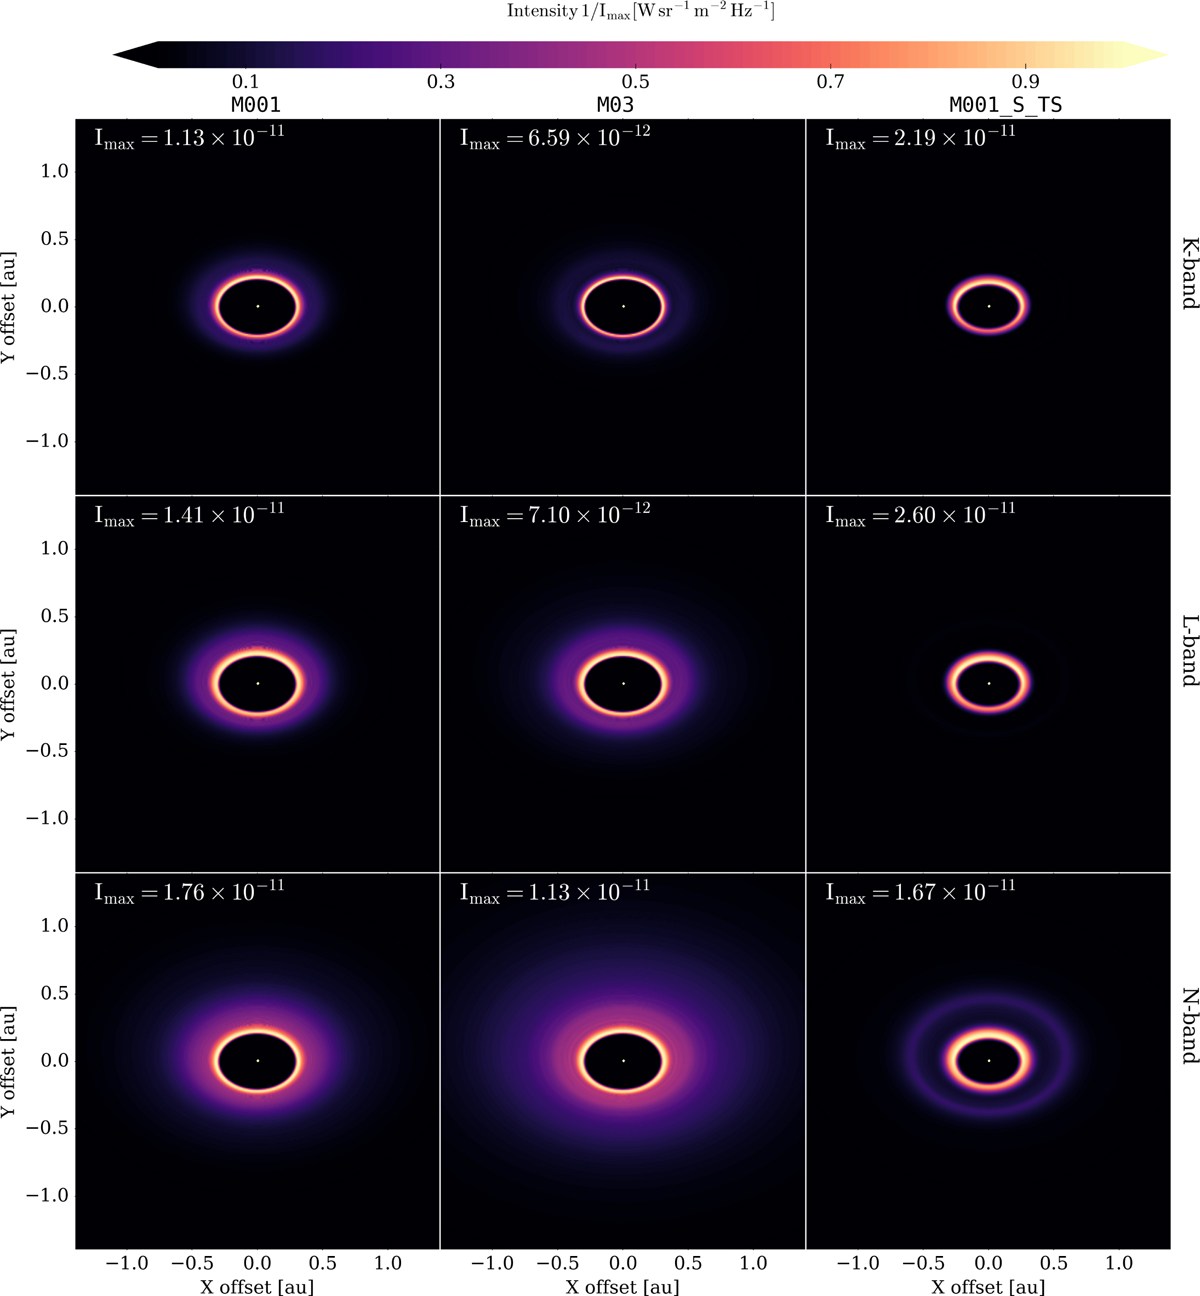
Download original image
2D intensity map calculated for an inclination of 45° in the K band (2.2 μm, top), L band (3.45 μm, middle), and N band (10 μm, bottom) using a linear color map and normalized over the individual peak intensity in units of W sr−1 m−2 Hz−1. From left to right: Models M001, M03, and M001_S_TS.
Current usage metrics show cumulative count of Article Views (full-text article views including HTML views, PDF and ePub downloads, according to the available data) and Abstracts Views on Vision4Press platform.
Data correspond to usage on the plateform after 2015. The current usage metrics is available 48-96 hours after online publication and is updated daily on week days.
Initial download of the metrics may take a while.