Fig. 11
Download original image
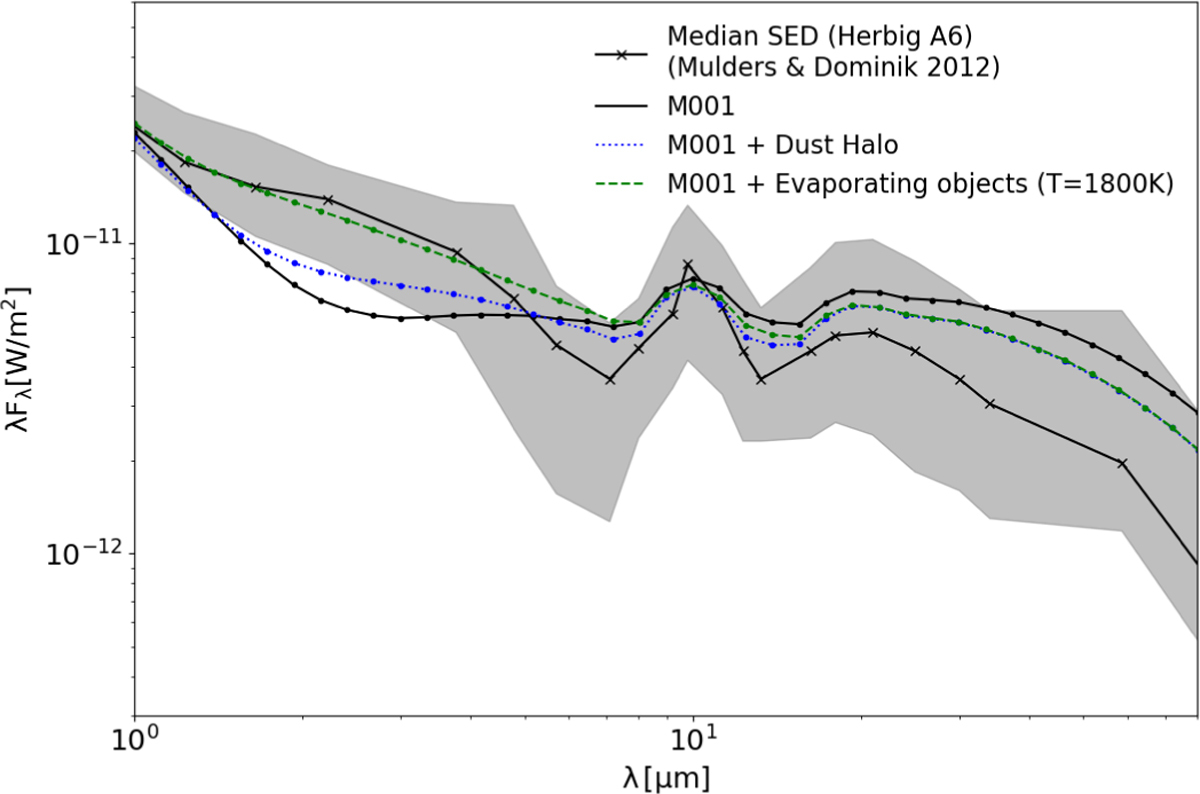
Similar to Fig. 7, showing the SED for two additional models that include a dust halo (dotted blue line) and evaporating objects (dashed green line). The solid black line (crosses) and gray shading show the median SED and one-sigma error constructed by Mulders & Dominik (2012). All values shown here were normalized to a distance at 100 pc.
Current usage metrics show cumulative count of Article Views (full-text article views including HTML views, PDF and ePub downloads, according to the available data) and Abstracts Views on Vision4Press platform.
Data correspond to usage on the plateform after 2015. The current usage metrics is available 48-96 hours after online publication and is updated daily on week days.
Initial download of the metrics may take a while.