Fig. E.2
Download original image
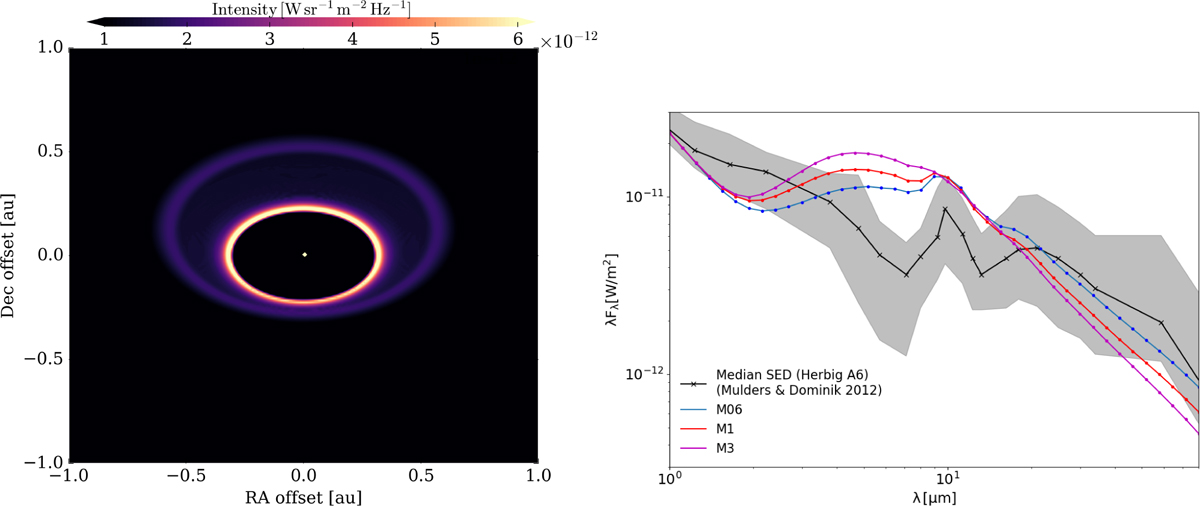
Left: 2D intensity map calculated for an inclination of 45° at 2.2 μm zoomed into the 1 au region shown for the very magnetized model M3. Right: SED for the high magnetized models from M06 to M3 showing the 64 calculated wavelength points (dots). The gray shaded color and solid black line show the median SED constructed by Mulders & Dominik (2012). All values were normalized to a distance at 100 pc.
Current usage metrics show cumulative count of Article Views (full-text article views including HTML views, PDF and ePub downloads, according to the available data) and Abstracts Views on Vision4Press platform.
Data correspond to usage on the plateform after 2015. The current usage metrics is available 48-96 hours after online publication and is updated daily on week days.
Initial download of the metrics may take a while.