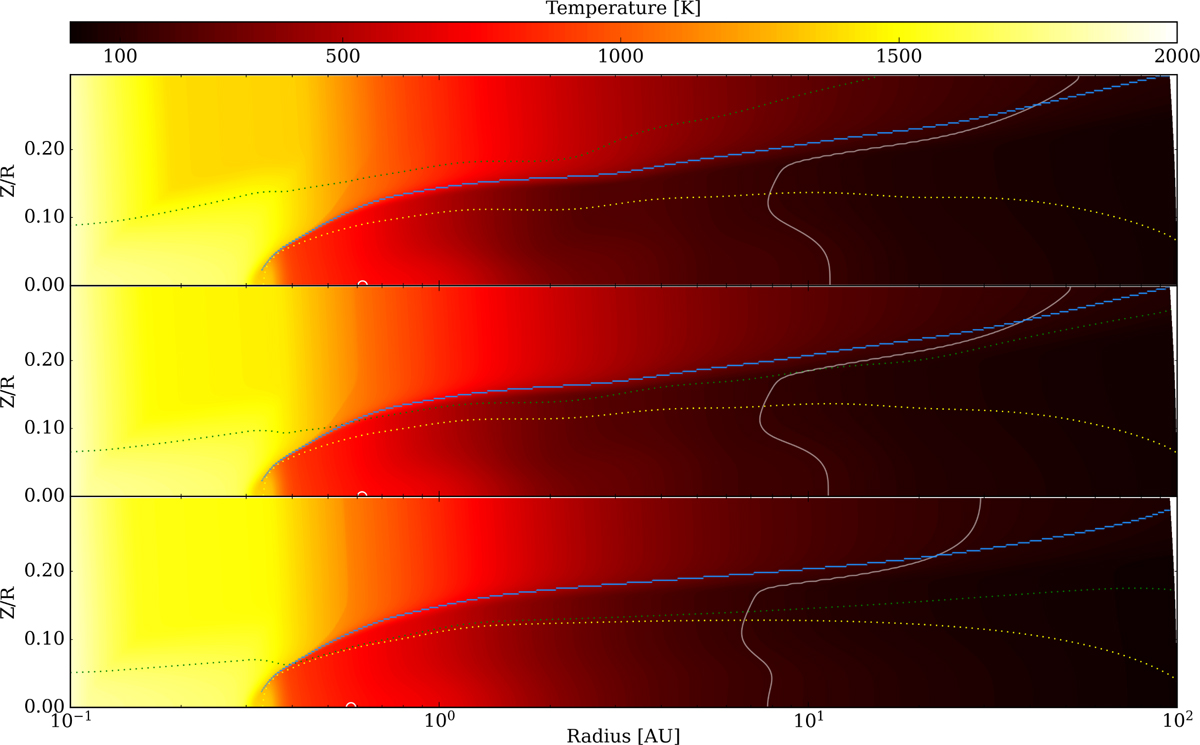
Fig. 6
Download original image
2D temperature profile with increasing magnetization from top to bottom, showing models M001, M01, and M03. The dotted green line shows the plasma beta unity line. The blue line shows the location of maximal irradiation heating corresponding to the τr = 1 line. Using the local Planck opacity, the dotted yellow line shows the τz = 1 line. The solid white line shows the water snow line.
Current usage metrics show cumulative count of Article Views (full-text article views including HTML views, PDF and ePub downloads, according to the available data) and Abstracts Views on Vision4Press platform.
Data correspond to usage on the plateform after 2015. The current usage metrics is available 48-96 hours after online publication and is updated daily on week days.
Initial download of the metrics may take a while.