Fig. 8
Download original image
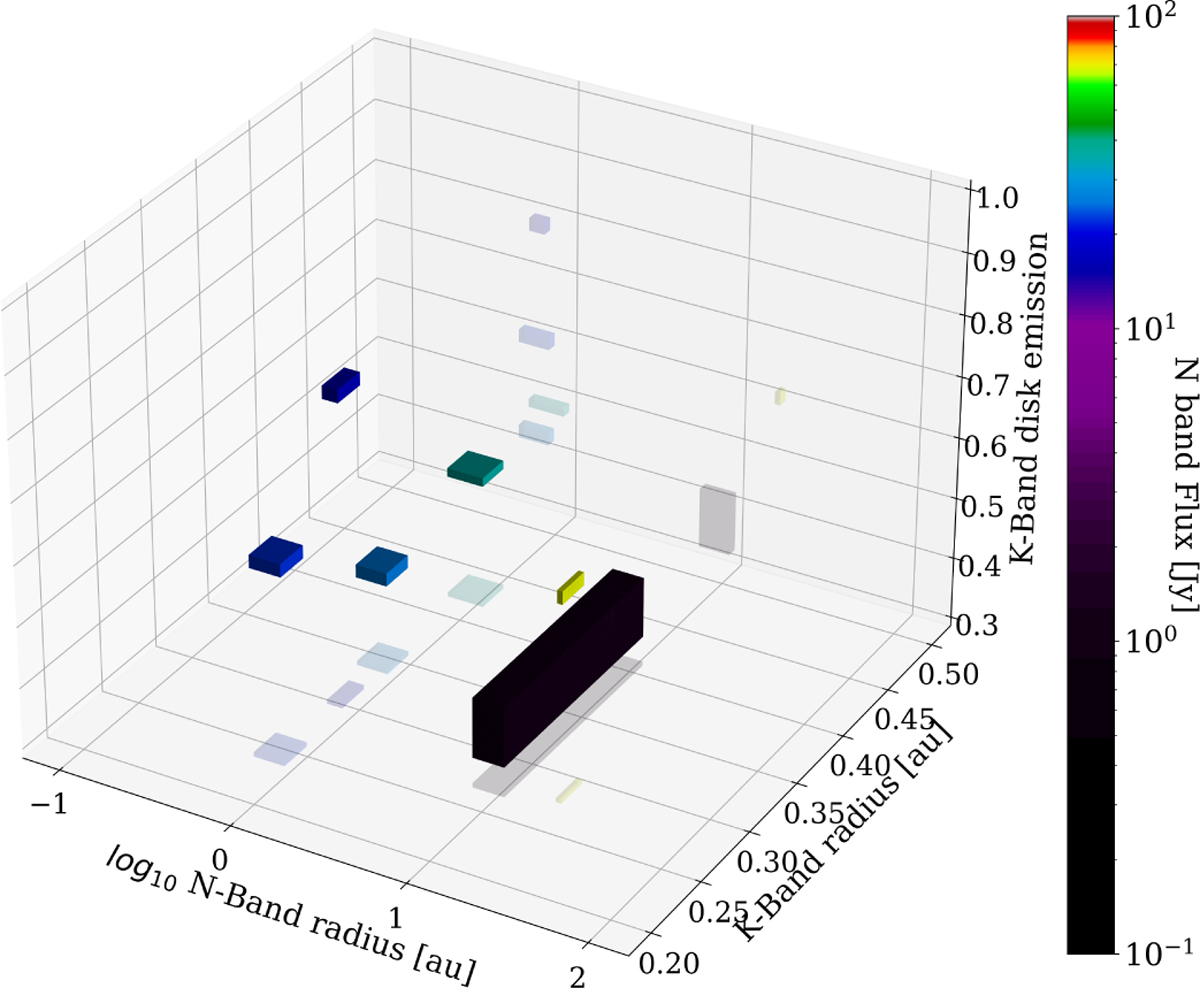
Visualizing the entries in Table 5. For the observed disks, the position and size of the block size represent the corresponding value and error. For the model entries, we set a constant block size (the three equally sized blocks). The color of the block represents the N-band flux normalized at 100 pc for each object and model.
Current usage metrics show cumulative count of Article Views (full-text article views including HTML views, PDF and ePub downloads, according to the available data) and Abstracts Views on Vision4Press platform.
Data correspond to usage on the plateform after 2015. The current usage metrics is available 48-96 hours after online publication and is updated daily on week days.
Initial download of the metrics may take a while.