Fig. 2.
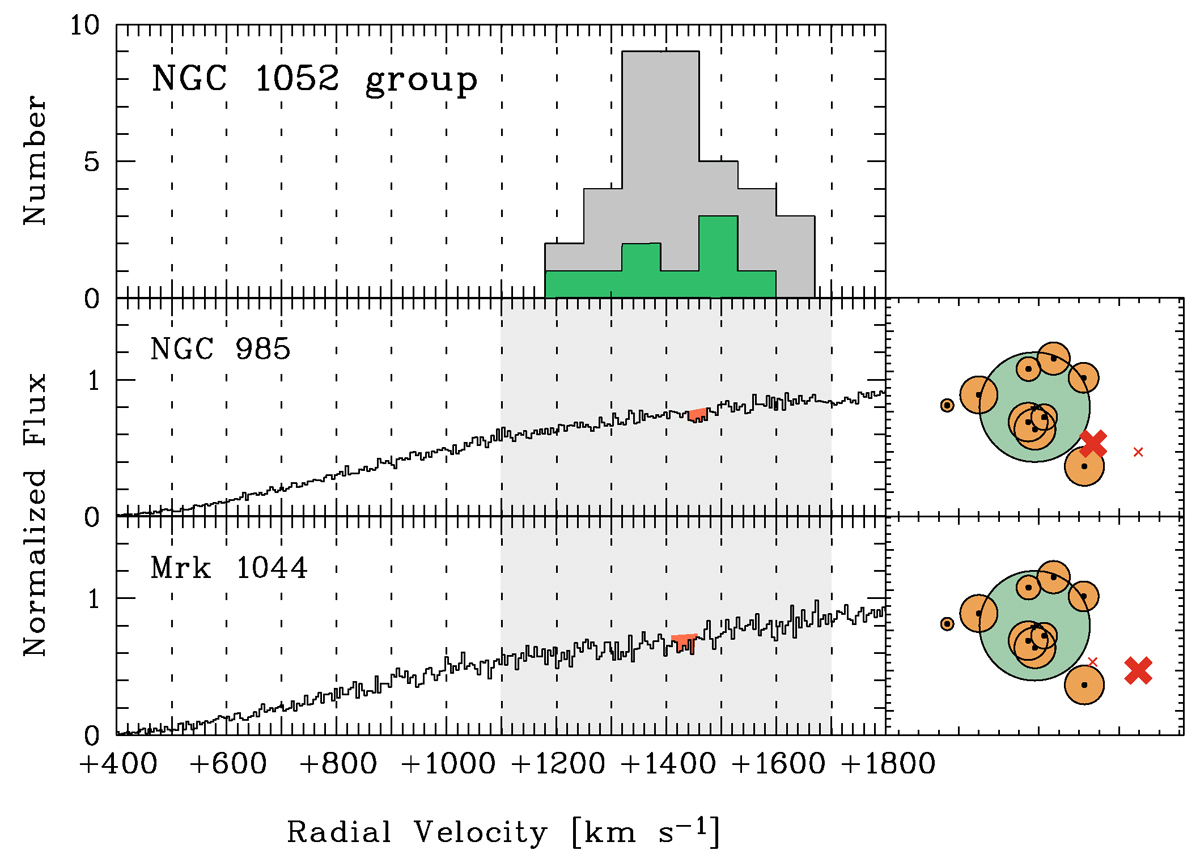
Download original image
Velocity plots for H I Ly α absorption for the sightlines passing the outer environment of the NGC 1052 group (lower two panels). OGrM absorbers are marked in dark orange. The expected radial velocity range for OGrM absorption is indicated with the gray-shaded area (see Sect. 2.3). The upper panel shows the velocity distribution for group member galaxies (green histogram) and for all galaxies in the group’s field (gray histogram).
Current usage metrics show cumulative count of Article Views (full-text article views including HTML views, PDF and ePub downloads, according to the available data) and Abstracts Views on Vision4Press platform.
Data correspond to usage on the plateform after 2015. The current usage metrics is available 48-96 hours after online publication and is updated daily on week days.
Initial download of the metrics may take a while.