| Issue |
A&A
Volume 701, September 2025
|
|
|---|---|---|
| Article Number | A75 | |
| Number of page(s) | 15 | |
| Section | Extragalactic astronomy | |
| DOI | https://doi.org/10.1051/0004-6361/202453135 | |
| Published online | 03 September 2025 | |
Studying the gaseous outskirts of galaxy groups with coherent Ly α absorption patterns⋆
1
Institut für Physik und Astronomie, Universität Potsdam, Karl-Liebknecht-Str. 24/25, 14476 Golm, Germany
2
Department of Astronomy & Astrophysics, 525 Davey Lab, The Pennsylvania State University, University Park, PA 16802, USA
3
AURA for ESA, Space Telescope Science Institute, 3700 San Martin Drive, Baltimore, MD 21218, USA
4
Department of Physics & Astronomy, Nieuwland Science Hall, The University of Notre Dame, Notre Dame, IN 46556, USA
5
Eureka Scientific, Inc., 2452 Delmer Street, Oakland CA 94602, USA
⋆⋆ Corresponding author: This email address is being protected from spambots. You need JavaScript enabled to view it.
Received:
23
November
2024
Accepted:
15
July
2025
Abstract
Aims. In this study, we explore the properties of diffuse intergalactic gas residing on the outskirts of the four nearby, low-mass galaxy groups NGC 1052, NGC 5866, NGC 4631, and NGC 3992 (all at cz ≤ 2000 km s−1) beyond their group virial radii.
Methods. Using archival ultraviolet absorption spectra of bright active galactic nuclei (AGNs) observed with the Hubble Space Telescope (HST) and its Cosmic Origins Spectrograph (COS), we searched for H I Ly α absorption near the groups’ recession velocities along 35 sightlines that pass the outer group medium (OGrM) at normalized impact parameters of ρ/Rvir = 1 − 3. We derived H I column densities of the absorbers and constrained the physical conditions in the gas (thermal pressure, density, neutral gas fraction, absorption path-length) by using a hydrostatic toy model of the groups’ gas environment and assuming photoionization.
Results. H I Ly α absorption near the groups’ recession velocities is detected along 19 sightlines with H I column densities in the range of log (N(H I)/cm−2) = 12.50 − 14.34, implying a high OGrM detection rate of more than 50 percent. We transform this value into an incidence rate of OGrM absorbers per unit redshift of d𝒩/dz = 232 ± 58 for absorbers with log (N(H I)/cm−2)≥13.2 and ρ/Rvir = 1 − 3. This is 25 percent above the value derived for the general population of Ly α absorbers within z = 0 filaments and more than twice the value for the z = 0 Ly α forest (considering the same column-density range). From the modeling, we obtain lower limits for the gas densities from log (nH/cm−3) = − 5.00 to −3.72, comparable to densities found in the overall Ly α forest.
Conclusions. Our study unveils a large cross section and overdensity of Ly α absorbers on the outskirts of these four nearby groups. Such an overdensity is in line with a previously proposed scenario in which AGN feedback lifts gaseous material to large distances beyond the virial radius of groups into the OGrM. However, a larger survey of OGrM absorbers and a comparison with hydrodynamical simulations will be necessary to constrain the cosmological mass density of OGrM absorbers and pinpoint their role in cosmological structure formation and galaxy and group evolution.
Key words: techniques: spectroscopic / galaxies: evolution / galaxies: groups: general / intergalactic medium / quasars: absorption lines
Based on observations obtained with the NASA/ESA Hubble Space Telescope, which is operated by the Space Telescope Science Institute (STScI) for the Association of Universities for Research in Astronomy, Inc., under NASA contract NAS5D26555.
© The Authors 2025
 Open Access article, published by EDP Sciences, under the terms of the Creative Commons Attribution License (https://creativecommons.org/licenses/by/4.0), which permits unrestricted use, distribution, and reproduction in any medium, provided the original work is properly cited.
This article is published in open access under the Subscribe to Open model. This email address is being protected from spambots. You need JavaScript enabled to view it. to support open access publication.
1. Introduction
Galaxy groups in the mass range M = 1012 − 1014 M⊙ represent particularly representative cosmological structures in the Universe, as they harbor the majority of the star-forming galaxies in the Universe (Mulchaey 2000; Eke et al. 2006; Lovisari et al. 2021). In addition, the dark matter (DM) halo mass function at low redshift peaks in this mass range (e.g., Despali et al. 2014). In the canonical picture of the Universe’s large-scale structure, such low-mass galaxy group environments represent mildly overdense matter knots in the filamentary cosmic web (Tempel et al. 2014). In contrast to more massive groups and clusters, the intra-group medium (IGrM) in low-mass groups is too cold (and too diffuse) to be detectable in X-ray emission throughout the overall group environment (Mulchaey et al. 1996). This leaves absorption-line spectroscopy against bright active galactic nuclei as the only efficient method to systematically explore the diffuse, multi-phase IGrM with a particular focus on H I Ly α/Ly β and, potentially, low, intermediate, and high metal ions such as C II, Mg II, Si III, Si IV, C IV, and O VI (Savage et al. 2014; Stocke et al. 2014; Richter et al. 2016; Bielby et al. 2017; Manuwal et al. 2019; Sameer et al. 2022). Recent absorption-line studies of individual group environments unveil absorber properties and absorber-to-galaxy relations that differ from the ones in isolated galaxy environments (Stocke et al. 2019; Pointon et al. 2017, 2020), reflecting the ongoing cosmological structure formation in these overdense regions. Star formation activity, triggered by gas-accretion processes in groups, will lead to outflows and winds, depositing energy and heavy elements in the IGrM that can be detected by measuring high ion absorption (e.g., from C IV and O VI) along sightlines that pass group environments (e.g., Burchett et al. 2018; Stocke et al. 2019; Sameer et al. 2022). Other case studies of preselected group environments with multiwavelength observations demonstrate that galaxy mergers have a crucial influence on the large-scale properties of the IGrM (Yun et al. 1994; Borthakur et al. 2010; Richter et al. 2018). This is supported by zoom-in cosmological simulations of groups, which demonstrate that the covering fraction of high-column-density gas in the IGrM rises substantially in the time-frame of merger events, leaving their imprints on the cross section of intermediate and high ions (see Oppenheimer et al. 2021 and references therein). Characterizing the gas-circulation processes in the IGrM around galaxies as a function of their immediate cosmological environment is therefore of fundamental importance to understanding cosmological structure formation.
So far, very little attention has been paid in the literature to absorption signatures of gas on the outskirts of low-mass galaxy groups beyond the group’s virial radius (and beyond the virial radius of group member galaxies), where the groups connect to the cosmic web. As recent studies imply, the gaseous outskirts of groups are believed to host a substantial number of baryons in the form of warm/hot gas, a direct result of AGN feedback that potentially lifts gaseous material to large distances even beyond the groups’ virial radii (see Eckert et al. 2021, and references therein). From this reservoir, group member galaxies can accrete metal-poor gas to fuel star formation, making this gas component particularly interesting for our understanding of galaxy evolution. In this interface region between the IGrM and the ambient filamentary IGM, the mean gas density is expected to be very low (close to that of the IGM itself) where nH < 10−4 cm−3, typically (Martizzi et al. 2019). As a result, metal absorption is expected to be very rare, leaving H I Ly α absorption as the only sensitive tracer of this gas, which we hereafter refer to as the outer-group medium (OGrM). Note that, in this definition, OGrM Ly α absorbers represent a subclass of Ly α filament absorbers (e.g., Wakker et al. 2015; Bouma et al. 2022) and the overall Ly α forest (e.g., Lehner et al. 2007; Danforth et al. 2016), as groups and their gaseous environment represent galaxy overdensities within the hierarchically structured cosmic web. As the OGrM is expected to be gravitationally coupled to the groups’ DM potential, OGrM absorbers are expected to cluster around the groups’ recession velocities (redshift). This is possibly separating them from “free-floating” absorption systems within the cosmic web or in voids that do not have such a clear kinematic association with galaxy concentrations.
The above considerations motivated us to start a systematic search for OGrM H I Ly α absorption features in archival HST/COS spectra along sightlines that pass nearby galaxy groups and analyze their properties. In this pilot study, we present our results for four nearby galaxy groups at recession velocities of cz ≤ 2000 km s−1: the NGC 1052 group, the NGC 5866 group, the NGC 4631 group, and the NGC 3992 group.
This paper is organized as follows. In Sect. 2, we present the search strategy, the data basis and handling, and the analysis method. In Sect. 3, we discuss the individual OGrM absorbers and their relation to the groups. The properties of the absorbers and the physical conditions in the gas are discussed in Sect. 4. A summary of our study as well as final conclusions are presented in Sect. 5. The appendix provides additional information on the continuum-fitting process and the hydrostatic toy model.
2. Data handling and analysis method
2.1. Search strategy
To study diffuse gas in the large-scale environment of nearby galaxy groups, we have combined archival ultraviolet (UV) spectral data from HST/COS with publicly available galaxy data and information from various galaxy-group surveys. As a spectral data basis, we used 1040 COS G130M+G160M datasets of distant (z > 0.01) AGNs and galaxies downloaded from the MAST archive, as were available to us by February 2025. For this, we used the data selection strategy outlined in our previous HST/COS archival surveys (Richter et al. 2016, 2017). Since we are aiming to study the H I Ly α absorption signatures of very nearby (in a cosmological sense) galaxy groups at recession velocities cz ≤ 5000 km s−1, we have preselected the 311 AGN spectra that have a signal-to-noise ratio of S/N ≥6 per 17 km s−1 wide spectral resolution element of COS at 1230 Å. This S/N cutoff was chosen because of the fact that it becomes very difficult to unambiguously identify weak absorption features in the extended wing of the Galactic interstellar Ly α absorption at S/N < 6. We also do not consider the spectra for which the flux distribution in the red wing of the interstellar Ly α absorption is highly irregular (so that a reliable reconstruction of the continuum is not possible) or that exhibit a critical number of blending lines at λ = 1220 − 1230 Å from other systems at higher redshift.
To identify z ≈ 0 galaxy groups that lie in the vicinity of the preselected archival HST/COS AGN sightlines, we used the classical group catalog of very nearby (cz ≤ 6000 km s−1) galaxy groups and their brightest member galaxies from Fouqué et al. (1992) to calculate the group’s mass and radial extent (see Sect. 2.2). For each group listed in this catalog, we created finding charts by cross-correlating the positions of the COS AGNs with the group’s positions in an impact-parameter range between 1 − 3 Rvir. In this way, we identified outer-group environments at cz ≤ 5000 km s−1 that are sampled by at least two AGN sightlines. All in all, we have identified 14 galaxy groups in this manner whose OGrM can be studied in H I Ly α absorption with archival HST/COS data.
In this study, we focus on four particularly interesting nearby group environments at cz ≤ 2000 km s−1: the NGC 1052 group, the NGC 5866 group, the NGC 4631 group, and the NGC 3992 group. Throughout the following, we use the group names from the original work by Fouqué et al. (1992), except for the group labeled as “Ursa Major I North group” in Fouqué et al. (1992), for which we use the alternative name “NGC 3992 group” to avoid confusion with the labeling of Ursa Major group environments used in other group catalogs (see Wolfinger et al. 2016). The “NGC 4631 group” is also known under the name “Coma I group” and the circumgalactic environment of NGC 4631 itself has previously been studied by us using UV absorption-line data from HST/COS in combination with H I 21 cm from the HALOGAS survey (Richter et al. 2018). Alternative group names are listed in the second column of Table 1.
Group parameters.
Based on our HST/COS archival dataset and the above-mentioned selection criteria, we identify 56 HST/COS spectra that sample the outer environment of these four groups in the range ρ/Rvir = 1 − 3. Of these, however, 21 sightlines exhibit Ly α absorption that we associate with the circumgalactic medium (CGM) of group-member galaxies or foreground galaxies, as is discussed in Sect. 2.3. Therefore, our final, CGM-corrected spectral sample consists of 35 AGN sightlines that can be used to study the OGrM of these four groups.
Some of these AGNs have been observed by COS at a relatively high S/N of > 20 per resolution element, so that very weak H I Ly α absorbers at column densities N(H I) ≤ 1013 cm−2 can also be detected. These four groups, together with the rich HST/COS dataset, therefore represent an ideal starting point for a sensitive first systematic study of the OGrM in Ly α absorption. In Table 1, we summarize the main properties of the NGC 1052, NGC 5866, NGC 4631, and NGC 3992 groups.
2.2. Group parameters and galaxy data
For our study, we use the group catalog from Fouqué et al. (1992), which is particularly strict in defining group members. In this catalog, only the largest group member galaxies with isophotal diameters of D25 ≥ 1001 arcsec are considered, which contain most of the stellar mass and luminosity of these groups. As was described in Gourgoulhon et al. (1992), the group members were identified using a hierarchical finding algorithm, whereby the hierarchy was built on the mass density of the aggregates progressively formed by the algorithm. Only those galaxy aggregates that have a B-band luminosity density higher than 8 × 10⁹ L⊙ Mpc−3 were considered, ensuring that the group is gravitationally bound. In addition, the galaxy-selection criterion, together with the hierarchical method, warrants that contamination with field galaxies and due to projection effects with filaments is minimized (see discussion in Gourgoulhon et al. 1992). The latter two aspects are particularly important for our study, as we use the kinematic information on the confirmed members galaxies to define the search window for Ly α absorption associated with the groups and separate the OGrM absorber statistics from that of “field” and filament Ly α absorbers (Danforth et al. 2016; Bouma et al. 2022; Wakker et al. 2015).
Galaxy data for the 58 confirmed group members (as listed in Fouqué et al. 1992, see Table 1, 7th column) and for other, potential group member galaxies that are spatially and kinematically aligned with the four groups have been extracted from the NED and SIMBAD online databases. These data include J2000 coordinates, B-band magnitudes, distances, and radial velocities for a total of 430 galaxies in the four group fields displayed in Fig. 1. Since all these galaxies are very nearby (D ≤ 20 Mpc), we estimate that our galaxy sample is complete down to luminosities of ∼0.08 L⋆ (see French & Wakker 2017, their Fig. 1).
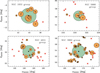 |
Fig. 1. Spatial distribution of galaxies in the NGC 1052, NGC 5866, NGC 4631, NGC 3992 galaxy groups together with the galaxies’ (orange-shaded circles) and groups’ (green-shaded circles) virial radii and the position of the selected background AGNs sampled by HST/COS data (red crosses). |
For the group member galaxies, we derived B-band luminosities and virial radii (Rvir) of the galaxies using the scaling relation from Richter et al. (2016, their Equation (3)), which is based on the approach described in Stocke et al. (2013). From the positions of the galaxies, we then calculated the luminosity-weighted group center coordinates, given in Table 1 (columns 3 & 4). For each of the four groups, we then derived the velocity dispersion of the group member galaxies using the relation from Osmond & Ponman (2004),
 (1)
(1)
where Ngal denotes the number of group members, v is the velocity of each individual group member, and  is the mean galaxy velocity in the group. For the determination of the dynamical mass of each group (Table 1, 8th column), we used the relation of Tully (2015),
 (2)
(2)
where we have to assume the groups to be virialized. For low-mass groups, however, the latter assumption may not hold (e.g. Marini et al. 2025), introducing a substantial systematic uncertainty in the determination of the dynamical group mass.
An alternative way to determine the mass of low-mass groups is to consider the group’s total luminosity (see discussion in Marini et al. 2025). To do this, we used the luminosity-to-mass conversion scheme presented in Stocke et al. (2019, their Equation (4)) together with a group mass-to-light ratio of ⋎grp = Mgrp/Lgrp = 150, as is appropriate for groups with total luminosities of log (Lgrp/L⊙)≤11.2 (Proctor et al. 2015), to define
 (3)
(3)
The luminosity-based group masses, ML, derived in this way are listed in the ninth column of Table 1. As can be seen, the values for ML are slightly higher than for Mdyn (∼0.25 dex), which is possibly related to the fact that these groups are not (yet) fully virialized. For the following, we therefore use ML as a measure for the groups’ total masses.
To characterize the groups’ radial extent, we calculated Rvir for each group under the assumption that that their potentials follow an NFW profile (Navarro et al. 1995). For this, we used the relation (A1) given in Richter (2020), which is based on the work by Maller & Bullock (2004), whereby we assumed a virial overdensity of Δvir = 360 at the virialization redshift of z = 0 (see also Shull 2014)2.
While we did not use the data for the other galaxies in the group fields to determine group masses and virial radii (as their group-membership status is unclear), we do consider these galaxies in Sect. 3 to identify (and sort out) CGM absorbers that arise in the halos of these “field” galaxies.
In Fig. 1, we display the spatial distribution of the galaxies in the four groups together with the member galaxies’ Rvir and the groups’ virial radii. The positions of the background AGNs are indicated with red crosses.
2.3. COS data and their spectral analysis
The overall strategy of the data reduction and analysis method of the HST/COS data follows the approach that we have used in our previous surveys and studies involving HST/COS spectral data (e.g., Richter et al. 2016, 2017; Richter 2020). The original (raw) data of the individual COS science exposures (from the G130M and G160M gratings) of the AGN sample available to us were processed by the CALCOS pipeline (v3.4.3) and transformed into standard x1d fits files. In a second step, the individual exposures were then coadded using a custom-written code that aligns individual exposures based on a pixel and wavelength calibration (see Richter et al. 2017, for a detailed description).
For our study of H I Ly α absorption in the OGrM in nearby groups at cz ≤ 2000 km s−1, the relevant wavelength range is 1215.67 − 1223.78 Å. This short wavelength interval is covered by the COS G130M grating, which operates from 1150 − 1450 Å at a spectral resolution of R ≈ 15 000 − 18 000 (≈20 − 17 km s−1 FWHM), depending on wavelength, central wavelength setting, and the lifetime position of the COS detector. The native pixel size in the data is 3 km s−1 (Green et al. 2012; Debes et al. 2016). With this targeted wavelength range, the OGrM Ly α absorption is expected to arise in the red wing of the damped interstellar Ly α absorption trough (centered near 1215.67 Å), which typically reaches out to λ = 1220 − 1227 Å depending on the local H I column density in the direction of the background AGN. Therefore, each COS spectrum used in this study was carefully continuum normalized in the 1215 − 1230 Å range using the custom-written spectral analysis code span (Richter et al. 2013) together with a Voigt-profile model of the foreground Milky Way interstellar Ly α absorption. An example of the continuum reconstruction of the interstellar Ly α trough toward NGC 985 is presented in the appendix in Fig. A.1.
As was mentioned above, a significant fraction of the sightlines in our original sample of 56 HST/COS spectra pass the immediate environment of group member galaxies or foreground galaxies, possibly tracing their CGM rather than the OGrM of the group. As a criterion for a positive CGM Ly α detection, we required the sightline to pass a galaxy at an impact parameter of ρ ≤ Rvir with the absorption arising within ±500 km s−1 of the galaxy’s systemic velocity. We found 21 such cases in our sample and removed these sightlines from our analysis, which left 35 sightlines for the OGrM analysis (Table 2). Note that sightlines that do pass a galaxy at ρ ≤ Rvir and that do not exhibit Ly α absorption in the galaxy’s or group’s velocity range still indicate a significant non-detection for OGrM absorption in our sample.
List of AGN sightlines tracing OGrM absortption in the four groups.
In the next step, we scanned the remaining 35 COS spectra for intervening absorption features that could potentially represent H I Ly α absorption arising in the extended OGrM of these groups. For this, we considered a velocity range of Δvabs = Δvgal ± 150 km s−1, where Δvgal is the observed velocity range of the group member galaxies listed in Table 1, sixth column. Ly α-forest absorbers that are unrelated to the group and its environment could also coincidentally fall in this velocity range, however. This aspect needs to be taken into account because the line density of the Ly α forest at z = 0 is substantial, the number of Ly α absorbers per unit redshift, d𝒩/dz, being ≈100 for log N(H I) ≥ 13.2 (Lehner et al. 2007; Danforth et al. 2016). Since v = cz at z = 0, this line density implies that the likelihood of a randomly placed Ly α absorber in a low-z AGN spectrum coincidentally falling into a predefined velocity interval of width Δv = 500 km s−1 is non-negligible; namely, ∼0.17. The likelihood of a double-coincidence absorption in the same velocity interval along two adjacent lines of sight (LOSs) is much smaller, however: ∼0.03. To minimize the contamination by coincidental Ly α absorbers in our OGrM sample, we therefore consider Ly α absorbers within Δvabs as OGrM candidates only if i) they have at least one neighboring sightline with Ly α absorption in the same group velocity interval and ii) their absorption-velocity ranges overlap with each other. In this way, we expect OGrM absorbers to form a Ly α “coherence pattern” along adjacent sightlines (as they align in position and velocity, similarly to the group member galaxies). Similar considerations on random and nonrandom coincidences of Ly α absorbers have been used to study the coherence length of IGM structures against AGN pairs (e.g. Dinshaw et al. 1997).
For each detected OGrM Ly α candidate line, we measured the radial velocity and equivalent width (EW) using the span code and cross-checked whether it could be a metal line or higher H I Lyman-series lines from other intervening absorption systems at higher redshift. We did not find convincing alternative identifications for any of the detected absorption features, however, supporting the conclusion that they indeed represent H I Ly α absorption lines.
For the subsequent analysis, we used the component-modeling method implemented in span to derive column densities, log N(H I), and Doppler parameters (b values) for each resolved absorption component. In Fig. A.1, we show as an example the modeled Ly α OGrM absorber at 1222.6 Å toward NGC 985. For those absorbers, for which the absorber shape is uncertain (either due to particularly weak or particularly strong absorption), we applied the apparent optical depth (AOD) method (Savage & Sembach 1991) to obtain log N(H I) (or limits thereof) from a direct pixel integration (without gaining information on b). Throughout the paper, we give column densities in units of cm−2, particle densities in units of cm−3, and temperatures in units of K. All results from the absorption-line measurements and component modeling are summarized in Table 3.
Summary of absorption-line measurements.
The main properties of the 35 background AGNs and the S/N in the COS data are listed in Table 2. Instead of using the AGN names used in the COS archive, we list here the most appropriate AGN names (based on the NED/SIMBAD entries) in the second column of Table 2 with alternative names in parentheses.
3. Discussion of individual absorbers
3.1. General absorber statistics
In the final sample of 35 AGN spectra, H I Ly α absorption within the groups’ velocity range, Δvabs (shaded gray area in the velocity plots in Figs. 2–5), is detected along 19 sightlines (Table 3). Only one of these OGrM absorbers (toward Ton 133) possibly has associated metal absorption (Si III; see Sect. 3.4), so the vast majority of the systems are considered to be “Ly α-only absorbers” (but see also Muzahid et al. 2018, for a potential group-related population of weak metal absorbers). In Sects. 3.2–3.5, we discuss the properties of the absorbers individually for each group environment.
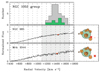 |
Fig. 2. Velocity plots for H I Ly α absorption for the sightlines passing the outer environment of the NGC 1052 group (lower two panels). OGrM absorbers are marked in dark orange. The expected radial velocity range for OGrM absorption is indicated with the gray-shaded area (see Sect. 2.3). The upper panel shows the velocity distribution for group member galaxies (green histogram) and for all galaxies in the group’s field (gray histogram). |
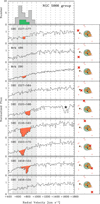 |
Fig. 3. Same as Fig. 2, but for the NGC 5866 group. Absorption lines not related to the OGrM or CGM of member and field galaxies are labeled with the star symbol. |
With these numbers, it is already evident that OGrM absorbers are frequent; the detection rate comes out to fdet = 19/35 = 0.54. More meaningful is the detection rate for a (minimum) limiting H I column density, Nlim, and a predefined range in impact parameter. For log Nlim = 13.2 and ρ/Rvir = 1 − 3, we have 34 sightlines with a sufficient S/N to detect H I Ly α absorption at that level and 16 OGrM absorbers detected at log N(H I) ≥ 13.2. This implies that fdet, 13.2 = 16/34 = 0.47 ± 0.12 for that impact parameter range, the large error being a result of the limited absorber statistics. In Sect. 4.2, we place this detection rate in a cosmological context, by comparing the incidence rate of Ly α absorption in the OGrM with that of Ly α absorption in the local Ly α forest and in nearby filaments.
The measured Ly α EWs in our OGrM absorber sample range from 17 to 505 mÅ, while the logarithmic H I column densities derived from the component-modeling and AOD methods have values of log N(H I) = 12.50 − 14.34 (see Table 3). This column-density range is very similar to that of the local Ly α forest (Lehner et al. 2007; Danforth et al. 2016; Bouma et al. 2022, see also Sect. 4.1), implying that these absorbers are predominantly ionized with only small neutral gas fractions. The b values derived from the H I component modeling for the OGrM absorbers lie in the range between 16 and 80 km s−1. Because of the limited spectral resolution and S/N of the COS data, however, the actual component structure may not be fully resolved. Therefore, the interpretation of the derived b values (in terms of line-broadening mechanisms) remains afflicted with large uncertainties (see discussion in Sect. 4.1).
In Figs. 2–5, we show velocity plots for the 35 sightlines that pass the OGrM of the four galaxy groups. In the top panel of each figure, we plot the histograms for the radial velocities of the groups’ confirmed member galaxies (green) and all galaxies found in these fields (gray). The expected velocity interval for OGrM Ly α absorption is indicated with the gray-shaded range in the velocity plots.
3.2. NGC 1052 group
There are 53 galaxies in the NGC 1052 group field (α2000 ≈ 44 − 36 deg, δ2000 ≈ −11 to −5 deg; see Fig. 1) in our galaxy sample with velocities between 1240 and 1680 km s−1, of which we regard 9 galaxies as group members. Two LOSs in our COS sample toward NGC 985 and Mrk 1044 pass the NGC 1052 group at normalized impact parameters of ρGC/Rvir = 1.24 and 2.04 from the group’s center (GC) position. H I Ly α absorption is detected within the group’s radial velocity range along both sightlines (see Fig. 2). Very weak (< 30 mÅ) but significant single-component Ly α absorption is detected at 1457 km s−1 (NGC 985) and 1433 km s−1 (Mrk 1044). Following our definition in Sect. 2.3, these absorbers define a coherent absorption pattern along these neighboring sightlines that are separated by 38 kpc at the distance of the NGC 1052 group. These two sightlines do not pass the CGM of any of the galaxies in this field (including group member galaxies and field galaxies). The S/N per resolution element in these two spectra is ≥50, and thus very high. Because of the weakness of these absorption features, we reanalyzed the two original datasets with an alternative version of the CALCOS sightline, recently developed in our group for the purpose of analyzing He II Ly α transmission spikes (Makan et al. 2021). These features also remain clearly present in the newly reduced dataset, however, with almost no changes in the flux distribution, leading us to conclude that they represent real intervening absorption features that trace the OGrM of the NGC 1052 group.
With column densities of log N(H I) = 12.75 (Mrk 1044) and 12.50 (NGC 985), these absorbers represent the weakest systems in our OGrM sample. Note that such weak systems would remain unnoticed in COS spectra with S/N < 30, and thus in most archival AGN datasets.
3.3. NGC 5866 group
The NGC 5866 group field is relatively sparse, with only 27 galaxies in the range of α2000 ≈ 237 − 220 deg, δ2000 ≈ 53 − 60 deg at velocities of v = 560 − 960 km s−1, of which 5 galaxies are regarded as secure group members. The group’s velocity dispersion (σgr = 82 km s−1) and total luminosity are small, resulting in a rather small group mass and virial radius (see Table 1).
The large-scale environment of the NGC 5866 group at ρGC/Rvir = 1 − 3 is sampled by nine AGN sightlines that are not contaminated by CGM absorption (see Sect. 2.3). The normalized impact parameters range from 1.04 to 2.94. The COS spectral data are of partly good and partly mediocre quality, with a S/N for most spectra of ≤15 (see Table 2). The majority of the sightlines (6/9) are located in the eastern region of the group (Fig. 1). Significant OGrM Ly α absorption in this velocity range is detected along six sightlines, forming a coherent OGrM absorption pattern (see definition in Sect. 2.3 and velocity plots in Fig. 3). The absorption velocities scatter around ∼800 km s−1.
The two relatively strong and broad absorbers toward SBS 1518+593 and SBS 1459+554 have an asymmetrical shape, which can be modeled by a two-component structure (Table 3). However, no associated metal absorption is detected in these systems; the same as for the other seven OGrM absorbers in the NGC 5866 group environment. The derived H I column densities for OGrM systems around the NGC 5866 group are between log N(H I) = 13.06 and 14.16 (see Table 3), and thus substantially higher than for the NGC 1052 group.
We note that the NGC 5866 group environment and the Ly α absorbers discussed here were also included in the study of Wakker et al. (2015) and identified as filament absorbers. This is no contradiction to our results, as OGrM absorbers (defined in Sect. 1) represent a subclass of filament absorbers that are spatially and kinematically coupled to knots in the cosmic web (i.e., to groups).
3.4. NGC 4631 group
The NGC 4631 group field (α2000 ≈ 198 − 177 deg, δ2000 ≈ 24 − 37 deg) is densely populated with 114 galaxies in the velocity range between 430 and 1030 km s−1. Of these, however, only 12 galaxies are regarded as secure members of the NGC 4631 group (Fouqué et al. 1992).
There are 15 sightlines in our AGN sample that pass the outer region of the NGC 4631 group beyond its virial radius at normalized impact parameters between ρGC/Rvir = 1.02 and 2.77 and at medium to low S/N (see Tables 2 and 3). Six of these sightlines sample the eastern part of the group at right ascensions > 192 deg, while the remaining nine sightlines cluster in the southwestern region of the group.
Only along 5 of the 15 sightlines is OGrM Ly α absorption detected, implying an OGrM detection rate that is substantially smaller than in the other three groups. The absorption velocities range between ∼700 and ∼1100 km s−1, while the EWs have values between 85 and 433 mÅ (see Table 3 and velocity plots in Fig. 4).
The OGrM absorber toward Ton 133 is the only OGrM system in our sample that potentially shows associated metal absorption (here: Si IIIλ1206.5). Since no other metal lines are detected, however, the identification of the Si III absorption remains ambiguous. The very broad (b = 53 km s−1) OGrM absorber toward the neighboring sightline SDSS J130429.03+311308.2 is potentially blended in the blue wing with intervening C IIIλ977.0 absorptionat zabs = 0.2477.
Following our definition in Sect. 2.3, these two absorbers form a coherent OGrM absorption pattern in the eastern part of the group, while the three absorbers along the neighboring sightlines toward RX J1212.2+2803, RX J1210.7+2725, and RX J1210.6+3157 form another coherent OGrM pattern in the southwestern part of the NGC 4631 group outskirts. Note that the immediate environment of NGC 4631 itself is characterized by a gigantic tidal gas stream that stems from the interaction of NGC 4631 with its neighboring galaxies (see Richter et al. 2018, their Fig. 2).
3.5. NGC 3992 group
The relatively large and well-populated NGC 3992 group field (α2000 ≈ 188 − 167 deg, δ2000 ≈ 49 − 59 deg) contains 236 galaxies at v = 590 − 1430 km s−1; 32 of these are regarded as members of the NGC 3992 group. Seven of the nine selected sightlines for this group pass the western outer environment of the NGC 3992 group at impact parameters between ρGC/Rvir = 1.77 and 2.77 (see Table 3). They sample an outer region of the group that still contains several massive galaxies (see Fig. 1). Six of these seven sightlines exhibit moderate to strong OGrM Ly α absorption in a coherent absorption pattern near 700 km s−1 with Ly α EWs between 131 and 342 mÅ and column densities in the range log N(H I) = 13.53 − 14.14. The two sightlines toward SBS 1213+549 and SDSS J120506.35+563330.9 in the eastern region at α2000 > 180 deg do not show any significant Ly α absorption in the velocity range of the NGC 3992group.
4. Nature and origin of the OGrM absorbers
4.1. Observational trends
With a detection rate of ∼50 percent in our survey, kinematically aligned OGrM Ly α absorbers appear to represent a typical absorber class in the outer regions of nearby galaxy groups, where these connect with the ambient cosmic web. Per definition, OGrM Ly α absorbers are kinematically aligned with their host groups to ensure that they trace the same overall cosmological environment. The question is what this alignment tells us about the nature of these systems.
On the one hand, the coherence in velocity along multiple sightlines could indicate that OGrM absorbers trace the same physical structure (i.e., one and the same “cloud”) probed at different locations, which (for instance) is floating from the cosmic web toward the group center (scenario I). On the other hand, the absorbers may represent independent gas structures (tracing density peaks) that move (“swarm-like”) as an ensemble of clouds within the group’s outer potential well (scenario II). Depending on the actual physical size and the separation between the sightlines at the distances of the groups, one could also think of a combination of both of these scenarios.
To visualize the geometrical setup, we have plotted in Fig. 6 the positions of the OGrM absorbers with respect to the confirmed group member galaxies in 2D and 3D projections (with the velocity as the third dimension). The dashed line indicates for each LOS the nearest neighboring sightline that also hosts an OGrM absorber. The linear distance to the nearest neighboring OGrM sightline, dN, calculated from the angular separation of the LOS and the group distance, is listed for each OGrM absorber in the last column of Table 3. As can be seen, values for dN range from 11 to 92 kpc, a linear scale on which both scenarios mentioned above appear realistic. We elaborate further on the absorber sizes in Sect. 4.4.
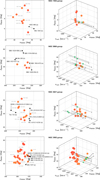 |
Fig. 6. Spatial configuration of the group member galaxies and the AGN sightlines for the four groups in our sample together with supplementary information. The left panel shows the projected position of group-member galaxies (orange dots) and the AGN sightlines along which OGrM absorption has been detected (black dots). The AGN names are labeled in black, the most important group member galaxies are labeled in gray. The right panel shows the group-member galaxies (orange dots) and the OGrM systems (green triangles) in a 3D position-velocity diagram. |
In Fig. 7, we plot the measured Ly α EWs and the derived H I column densities against the normalized absorber impact parameter to the group center. For the entire impact parameter range (ρ/Rvir = 1 − 3), there is a lot of scatter with no obvious trend. In future studies of the OGrM, using a larger absorber sample, it would be interesting to also systematically explore the range ρ/Rvir > 3 to search for observational trends that may (or may not) indicate a change in the physical conditions of the absorbers related to the decreasing cosmological matter overdensity in this interface region between collapsed group structures and the ambient cosmic web.
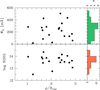 |
Fig. 7. Ly α EWs and logarithmic H I column densities of OGrM absorbers plotted against the relative absorber impact parameter to the group center. No clear trend can be seen in these plots. |
The overall distribution of H I column densities (lower right panel in Fig. 7) and the median value for log N(H I) of 13.68 are very similar to the ones derived for low-redshift IGM filaments (Bouma et al. 2022; Wakker et al. 2015) or in “blind” Ly α-forest surveys (Lehner et al. 2007; Danforth et al. 2016), implying that the average physical conditions are comparable. This is not really surprising, however, as OGrM absorbers represent a subclass of the overall intergalactic Ly α population and thus are included in the aforementioned surveys.
To explore in more detail the origin and physical conditions of the OGrM systems, one would like to know about the ionization conditions and gas densities in the absorbers, from which one could also derive a characteristic size. With H I Ly α absorption as the only information carrier for all but one of the absorbers, however, we have only a very limited diagnostic toolkit at hand to explore the physical conditions in the gas. Note that the lack of metal-line absorption in our sample of OGrM systems does not necessarily point toward a low metallicity of the OGrM, but rather is a result of the low gas column- and volume densities and the high degree of ionization, which is typical of intergalactic gas at such small cosmological overdensities (e.g. Martizzi et al. 2019, see also Sect. 4.3).
The directly measured quantities available for all OGrM absorbers in our sample are: H I column density, Doppler parameter, radial velocity, and the component structure. From these parameters alone, we can derive estimates for the gas densities, total gas column densities, and absorber sizes only using certain assumptions (Sect. 4.3).
In principle, the measured b value in each absorber provides an upper temperature limit for the gas, as the thermal component of the Doppler parameter can be written as bth2 = 2 kT/mH, with mH being the mass of the hydrogen atom. It is, however, commonly assumed that the observed b value is composed of a thermal and a nonthermal component, so that  . In our sample, the limited S/N and relatively low spectral resolution complicates the interpretation of the measured H Ib values as a temperature indicator because the component substructure may not be fully resolved. The measured b values in the OGrM absorber-components are all ≤53 km s−1 (see Table 3), with only one exception (the weak OGrM absorber toward SDSS J111443.65+525834.2, for which b is only poorly constrained; see last row in Table 3). A value of b = 53 km s−1 translates into an upper temperature limit of T ≤ 1.7 × 10⁵ K. This value is an order of magnitude lower than the expected virial temperatures of the groups (T > 4 × 10⁶ K) and lower than what is expected for (equilibrium) collisional ionization to be dominant (T > 2 × 10⁵ K; Richter et al. 2008). While we cannot exclude that nonequilibrium collisional ionization (e.g., Gnat & Sternberg 2007) and/or a mixture of collisional and photoionization are relevant, the moderate b values for the majority of the systems suggest that the OGrM absorbers are predominantly photoionized (possibly being embedded in a hotter, collisionally ionized gas phase).
4.2. The incidence rate of OGrM absorbers
The Ly α line density in an AGN spectrum usually is represented by d𝒩/dz, the number of Ly α absorbers per unit redshift, which characterizes the frequency and distribution of gas clouds in the cosmic web along that line of sight. The values for d𝒩/dz in “blind” z ≈ 0 Ly α surveys, where dz is calculated from the redshift paths for multiple AGN sightlines, range from d𝒩/dz ≈ 80 to 100 for log N(H I) ≥ 13.2 (Danforth et al. 2016; Lehner et al. 2007). Because v = cz at z ≈ 0, a value of d𝒩/dz = 100 for log N(H I) ≥ 13.2 implies that one expects – on average – one Ly α absorber per 3000 km s−1 wide velocity interval (above that column-density level).
Ly α lines are not randomly distributed in redshift space, however, as they follow the small- and large-scale matter distribution (i.e., galaxies, filaments, groups, clusters) in the cosmic web (e.g. Morris et al. 1993). The positions of Ly α lines along a AGN spectrum are thus determined by both the cosmological expansion and the peculiar gas motions within collapsed structures. Strong absorbers with log N(H I) ≥ 15 appear to be highly correlated with individual galaxies (e.g. Prochaska et al. 2011), while weaker systems tend to partly cluster in filaments (Bouma et al. 2022) or be part of a population of “random” Ly α absorbers that reside in under-dense regions (Tejos et al. 2012). Bouma et al. (2022) derived for their sample of velocity-selected Ly α absorbers within z = 0 filaments an incidence rate of d𝒩/dz = 189 ± 25 for log N(H I) ≥ 13.2. This is substantially higher than for the overall (unselected) Ly α population, reflecting the clustering of Ly α absorbers in cosmological filaments.
To compare the incidence rate of OGrM absorbers with that of filament absorbers and the overall Ly α forest, we followed the same approach as in Bouma et al. (2022) and transformed the observed OGrM detection rate into a d𝒩/dz value. The total OGrM absorption path length in our sample (in velocity units) is given by
 (4)
(4)
where i is the index for our four groups,  is the number of sightlines per group that have sufficient S/N to detect OGrM Ly α absorption at log N(H I) ≥ 13.2, fi ≤ 1 is a factor that corrects for line blends, and Δvi is the expected velocity range for OGrM absorption in group i, as is defined in Sect. 2.3. Since we have rigorously sorted out sightlines that are contaminated by CGM absorption within Δvi, we can safely set fi = 1.
Based on Equation (4), the total OGrM velocity path in our sample comes out to ΔvOGrM = 20 650 km s−1. Because v = cz at z = 0, this velocity range corresponds to an OGrM redshift pathlength of dz = ΔvOGrM/c = 0.06888. Note that the OGrM redshift pathlength calculated in this way has no cosmological meaning; it just indicates the integrated velocity range for OGrM absorption in our AGN sample in unit redshift (Δv/c). Having 16 OGrM absorbers at ρ/Rvir = 1 − 3 with log N(H I) ≥ 13.2, we thus derive d𝒩/dz = 16/0.06888 = 232 ± 58. This is more than twice the number density in the overall Ly α forest (d𝒩/dz = 80−100) and ∼25 percent above the value for z = 0 filaments (189; see above).
Our study therefore indicates that the outer regions of groups at ρ/Rvir = 1 − 3 are characterized by an overdensity of Ly α absorbers compared to other regions in the local cosmic web. The high value for d𝒩/dz in the OGrM needs to be reevaluated, however, and confirmed by a larger group and absorber sample.
4.3. Hydrostatic model
To shed more light on the physical conditions of the OGrM absorber population, we discuss a simple hydrostatic toy model, in which we regard the absorbers as mildly overdense gas patches that have neutral gas fractions high enough to be detectable in H I Ly α absorption and that are photoionized by the cosmic UV background. The fundamental assumption in this model is that the absorbing structures stay roughly in pressure equilibrium with their ambient gaseous environment and that the gas is in hydrostatic equilibrium, gravitationally confined by the underlying matter distribution.
We are aware of the fact that such a model represents a rather overidealized approach, as the assumption of hydrostatic equilibrium may not hold for gas on the outskirts of low-mass galaxy groups (Paul et al. 2017). However, in the absence of any alternative, more reliable approach, we are interested in exploring the outcome of such a model to get a general idea of realistic absorber densities and sizes that we then can relate to the observed OGrM absorption pattern and the angular separation between the sightlines.
We start our model description with the DM mass distribution within 3Rvir of the group centers, which we assume to follow a NFW profile (see also Sect. 2.2). Using the formalism described in Richter (2020), we calculated the expected radial gas pressure profiles of the gas bound to the groups within 3Rvir as a function of the groups’ total masses, ML (see Table 1). If we further assume that the projected distances of the absorbers to the group centers (i.e., the impact parameters) are equal to the actual radial distances, R, we can in this way obtain an estimate for P/k for each absorber. The resulting values are listed in the fourth row of Table 4. With the thermal pressure being P/k = nHT, ignoring nonthermal pressure components as well as assuming an upper temperature limit of log T = 4.5 for photoionized gas, we then obtain a lower limit for nH for each absorber from this model. The results for nH are shown in the sixth row of Table 4. The values that we obtain from this approach vary from log nH = −5.00 to −3.72, a density range that is characteristic of intergalactic (intra-group) environments and the Ly α forest, seen in hydrodynamical cosmological simulations (Martizzi et al. 2019). A direct consequence of our hydrostatic group model with constant T is that nH (such as P/k) decreases quickly with increasing distance R from the group center with a trend depending on the total group mass (Richter 2020, their Equation (A.12)). This trend is shown for all four groups in Fig. B.1 in the appendix.
Modeled physical conditions in the OGrM absorbers.
In our model, we regard photoionization by the cosmic UV background as the only relevant ionization process to ionize hydrogen in the OGrM absorbers. This is motivated by the fact that the OGrM absorbers are far away from any local ionization sources (such as AGNs or stars) and is supported by the temperature limits from the measured b values (see above). We adopt a photoionization rate of Γ = 7 × 10⁻¹⁴ s−1 for the z = 0 IGM, based on the results from Fumagalli et al. (2017). In analogy to H I absorbers in the z = 0 Ly α forest, we then can estimate the neutral gas fraction, fHI, in the absorbers assuming photoionization equilibrium and using the simple relation
 (5)
(5)
where T4 is the gas temperature in units of 104 K (see, e.g., Richter et al. 2008, and discussion therein). The temperature term in this equation reflects the temperature dependence of the hydrogen recombination coefficient. Since our model provides lower limits for log nH at a constant value of T4 = 3, we likewise obtain lower limits for fHI (Table 4, eighth column) and upper limits for the total hydrogen column density, N(H) = N(H I) + N(H II) = N(H I)/fHI (Table 4, seventh column). Finally, from the relation L = N(H)/nH, we get an upper limit for the absorption path length, L, in the absorbers that we can regard as a characteristic length scale for the absorbing structures. The limits for log (L/pc) are listed in the ninth column of Table 4. These span a large range between 1.09 and 4.83, corresponding to absorber sizes between 12 pc and 68 kpc with a median value of 2.8 kpc. Similarly large ranges in absorber sizes are also found in CGM absorbers, where the ionization conditions can be much more precisely constrained using the various transitions from intermediate and high metal ions and advanced modeling techniques (e.g., Sameer et al. 2024; Richter et al. 2009).
4.4. The origin and fate of OGrM absorbers
The absorber sizes, L, estimated from our hydrostatic model now can be directly compared with the linear distances between neighboring OGrM sightlines, dN (Sect. 4.1). In the last column of Table 4, we list the ratio (upper limit) between the absorber size and the distance to the nearest OGrM absorber, L/dN. Only for four OGrM absorbers in the NGC 5866 group is this ratio clearly < 1, suggesting that the estimated absorber-size limits are (substantially) smaller than the sightline separations. If (regardless of the simplicity of our modeling) this estimate reflects reality, these numbers would imply that these OGrM Ly α absorbers represent individual gas clumps that follow as a conglomerate the large-scale motions of matter in the outer regions of the groups’ potential wells (“swarm-like”, scenario II; see above).
For the remaining majority of the OGrM absorbers, however, the upper limits for L/dN are all above unity, some of them substantially. For these systems, both scenarios discussed in Sect. 4.1 are possible and it therefore cannot be excluded that the velocity alignment of OGrM absorption along these adjacent sightlines is a result of the fact that the various LOS that sample a coherent OGrM structure pass through the same kiloparsec-scale Ly α cloud.
While it is tempting to calculate an upper limit for the absorber’s total gas masses from our simple hydrostatic model to evaluate their contribution to the groups’ baryon budget, we refrain from doing so because of the unknown absorber geometry and the very large uncertainties that would come along with such an estimate. Future studies of OGrM absorbers in hydrodynamical cosmological simulations and the analysis of ultradeep X-ray observations would be of great help to understand i) whether the high incidence rate of OGrM absorbers derived in Sect. 4.2 is a result of AGN feedback, which potentially lifts and retains large amounts of warm and hot gas on the outskirts of galaxy groups (Eckert et al. 2021), or any other large-scale gas-circulation processes, ii) whether the (1 − 3)Rvir range around groups hosts a substantial baryon reservoir, and iii) the extent to which the photoionized OGrM absorbers are surrounded by a hotter, collisionally ionized medium. Similarly, hydrodynamical simulations of OGrM absorbers in group environments of different halo masses and evolutionary states will be important to understand the gas dynamics, the importance of OGrM absorbers for the general properties of the IGrM in the group centers, and their fate in their role as baryon carrier to feed the disks of group member galaxies and/or their hot coronal halos with metal-poor gas from the IGM(see Afruni et al. 2023).
5. Summary and conclusions
In this paper, we have studied coherent H I Ly α absorption patterns in the OGrM on the outskirts of four nearby (D ≤ 20 Mpc), low-mass galaxy groups (NGC 1052 group, NGC 5866 group, NGC 4631 group, and NGC 3992 group) using archival UV spectral data from HST/COS. For this, we have analyzed Ly α absorption near the groups’ systemic velocities along 35 AGN sightlines that i) pass the four groups at normalized impact parameters in the range ρ/Rvir = 1 − 3 and ii) are not contaminated by CGM absorption from foreground and group-member galaxies. The main results of our study can be summarized as follows:
(1) Coherent OGrM H I Ly α absorption (Ly α absorption that is measured at similar group radial velocities along ≥2 adjacent sightlines) with EWs between Wλ = 17 and 505 mÅ is detected along 19 out of the 35 sightlines. This high detection rate of more than 50 percent indicates that diffuse H I-absorbing gas on the outskirts of galaxy groups has a relatively large absorption cross section.
(2) From the modeling of the observed Ly α absorption profiles, we determined H I column densities and Doppler parameters for the 19 OGrM absorbers. The derived logarithmic H I column densities lie in the range of log N(H I) = 12.50 − 14.34 with a median value of 13.68, which is very similar to the column-density range found in the overall population of Ly α forest absorbers in nearby (z = 0) cosmological filaments (Bouma et al. 2022; Wakker et al. 2015) that the OGrM absorbers are part of. The derived Doppler parameters span a large range (b = 16 − 80 km s−1), but unresolved velocity structure is likely to be present in many of these lines. In the impact parameter range sampled by our study (ρ/Rvir = 1 − 3), we do not find any dependency between the Ly α EW/H I column density and the group impact parameter. Only one OGrM Ly α absorber in our sample possibly has associated metal-line absorption (Si III), while the vast majority of the systems are Ly α-only absorbers.
(3) We used a simple hydrostatic toy model for photoionized gas on the outskirts of galaxy groups to constrain the physical conditions in the observed OGrM absorber population. From this, we obtained lower limits for the gas densities from log nH = −5.00 to −3.72, comparable to the density range expected for the Ly α forest. The resulting upper limits for the absorber sizes lie between 12 pc and 68 kpc with a median value of 2.8 kpc. Only for four OGrM absorbers the estimated size limits are smaller than the linear separation between the adjacent OGrM absorbers in the group, suggesting that these absorbers represent independent gas structures (tracing gas-density peaks) that move as an ensemble within or toward the group’s potential well. For the remaining 15 absorbers, no clear statement can be made in this regard.
(4) By converting the observed OGrM Ly α absorption cross section into an incidence rate, we find that the number of Ly α absorbers per unit of redshift in nearby group environments is d𝒩/dz = 232 ± 58 for absorbers with N(H I) ≥ 13.2 and ρ/Rvir = 1 − 3. This is ∼25 percent above the value derived for Ly α absorbers in filaments at z = 0 (d𝒩/dz = 189 ± 25; Bouma et al. 2022) and more than twice the value for the overall z = 0 Ly α forest (d𝒩/dz = 80−100; Danforth et al. 2016; Lehner et al. 2007) considering the same column-density range. The large incidence rate may hint at a substantial reservoir of baryons on the outskirts of galaxy groups in the form of diffuse ionized gas, but future observations and simulations are required to reliably constrain the mass budget in the OGrM and its connection to AGN feedback (Eckert et al. 2021).
Our study of OGrM Ly α absorbers unveils a number of interesting properties of diffuse gas on the outskirts of galaxy groups that deserve to be addressed in a larger absorption-line survey. We are currently undertaking a fully automated analysis of all AGN spectra in the HST/COS archive as part of the QUALSTAR (Quasar Absorption Lines Standardized Automated Recovery) project (Richter, in prep.), from which we shall obtain detailed information on N, b, zabs for several thousand Ly α absorbers in the nearby Universe. This information will be directly compared to galaxy data from recent surveys to systematically investigate the connection between Ly α absorbers and their ambient large-scale environment (e.g., filaments, groups, and clusters). In this way, we shall pinpoint the gaseous matter distribution in the transition zones between cosmological filaments and knots in the cosmic web. The observational data will also be compared with mock spectral data synthesized from hydrodynamical cosmological simulations.
A particularly demanding observational task, yet one that is crucial for a better understanding of gas in group environments, will be obtaining a reliable estimate of the total gas mass that is hosted on the outskirts of groups. Such an estimate can only be obtained from a larger OGrM Ly α absorber sample in combination with deep X-ray observations that would trace the hot (T > 106 K) phase of the OGrM, which may carry the bulk of the baryons in this region. Also, a systematic analysis of the kinematics of Ly α absorbers at even larger distances (ρ/Rvir = 1 − 10) from the group centers is highly desired to characterize the streaming motion of these gas absorbers toward the group centers and to estimate the contribution of this matter reservoir to the galaxies’ gas accretion and star formation rate.
D25 is the isophotal diameter measured at a surface brightness of 25 magnitudes per square arcsecond.
Note that in the context of galaxy groups and clusters, their characteristic radius is often expressed in terms of r200, the radius for which the mass density profile of a halo equals 200 times the critical density of the Universe; at z = 0, Rvir > r200 and Rvir ≈ r100 (Bryan & Norman 1998).
Acknowledgments
This research has made use of the SIMBAD database, operated at CDS, Strasbourg, France. This research also has made use of the NASA/IPAC Extragalactic Database (NED), which is funded by the National Aeronautics and Space Administration and operated by the California Institute of Technology. The authors would like to thank the anonymous referee for helpful comments and suggestions.
References
- Afruni, A., Pezzulli, G., Fraternali, F., & Gronnow, A. 2023, MNRAS, 524, 2351 [NASA ADS] [CrossRef] [Google Scholar]
- Berlind, A. A., Frieman, J., Weinberg, D. H., et al. 2006, ApJS, 167, 1 [Google Scholar]
- Bielby, R., Crighton, N. H. M., Fumagalli, M., et al. 2017, MNRAS, 468, 1373 [CrossRef] [Google Scholar]
- Borthakur, S., Yun, M. S., & Verdes-Montenegro, L. 2010, ApJ, 710, 385 [NASA ADS] [CrossRef] [Google Scholar]
- Bouma, S. J. D., Richter, P., & Wendt, M. 2022, A&A, 647, A166 [Google Scholar]
- Bryan, G., & Norman, M. 1998, ApJ, 495, 80 [NASA ADS] [CrossRef] [Google Scholar]
- Burchett, J. N., Tripp, T. M., Wang, Q. D., et al. 2018, MNRAS, 475, 2067 [CrossRef] [Google Scholar]
- Chen, H.-W., Johnson, S. D., Zahedy, F. S., Rauch, M., & Mulchaey, J. S. 2017, ApJ, 842, L19 [Google Scholar]
- Danforth, C. W., Keeney, B. A., Tilton, E. M., et al. 2016, ApJ, 817, 111 [NASA ADS] [CrossRef] [Google Scholar]
- Debes, J. H., Becker, G., & Roman-Duval, J. 2016, COS Instrument Science Report, 15 [Google Scholar]
- Despali, G., Giocoli, C., & Tormen, G. 2014, MNRAS, 443, 2208 [Google Scholar]
- Dinshaw, N., Weymann, R. J., Impey, C. D., et al. 1997, ApJ, 491, 45 [Google Scholar]
- Eckert, D., Gaspari, M., Gastaldello, F., Le Brun, A. M. C., & O’Sullivan, E. 2021, Universe, 7, 142 [NASA ADS] [CrossRef] [Google Scholar]
- Einasto, M., Einasto, J., & Tenjes, P. 2024, A&A, 681, A91 [NASA ADS] [CrossRef] [EDP Sciences] [Google Scholar]
- Eke, V. R., Baugh, C. M., Cole, S., Frenk, C. S., & Navarro, J. F. 2006, MNRAS, 370, 1147 [Google Scholar]
- Fouqué, P., Gourgoulhon, E., Chamaraux, P., & Paturel, G. 1992, A&AS, 93, 151 [Google Scholar]
- French, D. M., & Wakker, B. P. 2017, ApJ, 837, 138 [NASA ADS] [CrossRef] [Google Scholar]
- Fumagalli, M., Haardt, F., Theuns, T., et al. 2017, MNRAS, 467, 4802 [Google Scholar]
- Garcia, A. M. 1993, A&AS, 100, 47 [NASA ADS] [Google Scholar]
- Gnat, O., & Sternberg, A. 2007, ApJS, 168, 213 [NASA ADS] [CrossRef] [Google Scholar]
- Gourgoulhon, E., Chamaraux, P., & Fouqué, P. 1992, A&A, 255, 69 [Google Scholar]
- Green, J. C., Froning, C. S., Osterman, S., et al. 2012, ApJ, 744, 60 [NASA ADS] [CrossRef] [Google Scholar]
- Lehner, N., Savage, B. D., Richter, P., et al. 2007, ApJ, 658, 680 [Google Scholar]
- Lovisari, L., Ettori, S., Gaspari, M., & Giles, P. A. 2021, Universe, 7, 139 [NASA ADS] [CrossRef] [Google Scholar]
- Makan, K., Worseck, G., Davies, F. B., et al. 2021, ApJ, 912, 38 [NASA ADS] [CrossRef] [Google Scholar]
- Maller, A. H., & Bullock, J. S. 2004, MNRAS, 355, 694 [CrossRef] [Google Scholar]
- Manuwal, A., Narayanan, A., Muzahid, S., et al. 2019, MNRAS, 485, 30 [Google Scholar]
- Marini, I., Popesso, P., Dolag, K., et al. 2025, A&A, 698, A191 [NASA ADS] [CrossRef] [EDP Sciences] [Google Scholar]
- Martizzi, D., Vogelsberger, M., & Artale, M. C. 2019, MNRAS, 486, 3766 [Google Scholar]
- Morris, S. L., Weymann, R. J., Dressler, A., et al. 1993, ApJ, 419, 524 [Google Scholar]
- Mulchaey, J. S. 2000, ARA&A, 38, 289 [NASA ADS] [CrossRef] [Google Scholar]
- Mulchaey, J. S., Mushotzky, R. F., Burstein, D., & Davis, D. S. 1996, ApJ, 456, L5 [Google Scholar]
- Muzahid, S., Fonseca, G., Roberts, A., et al. 2018, MNRAS, 476, 4965 [NASA ADS] [CrossRef] [Google Scholar]
- Navarro, J. F., Frenk, C. S., & White, S. D. M. 1995, MNRAS, 275, 56 [NASA ADS] [CrossRef] [Google Scholar]
- Oppenheimer, B. D., Babul, A., Bahé, Y., Butsky, I. S., & McCarthy, I. G. 2021, Universe, 7, 209 [NASA ADS] [CrossRef] [Google Scholar]
- Osmond, J. P. F., & Ponman, T. J. 2004, MNRAS, 350, 1511 [NASA ADS] [CrossRef] [Google Scholar]
- Paul, S., John, R. S., & Gupta, P. 2017, Kumar, H., 471, 2 [Google Scholar]
- Pointon, S. K., Nielsen, N. M., Kacprzak, G. G., et al. 2017, ApJ, 844, 23 [Google Scholar]
- Pointon, S. K., Kacprzak, G. G., Nielsen, N. M., et al. 2020, ApJ, 159, 216 [Google Scholar]
- Prochaska, J. X., Weiner, B., Chen, H. W., Mulchaey, J., & Cooksey, K. 2011, ApJ, 740, 91 [Google Scholar]
- Proctor, R. N., Mendes de Oliveira, C., Azanha, L., Dupke, R., & Overzier, R. 2015, MNRAS, 449, 234 [Google Scholar]
- Richter, P. 2020, ApJ, 892, 33 [Google Scholar]
- Richter, P., Paerels, F. B. S., & Kaastra, J. S. 2008, SSRv, 134, 25 [Google Scholar]
- Richter, P., Charlton, J. C., Fangano, A. P. M., Ben Bekhti, N., & Masiero, J. R. 2009, ApJ, 695, 1631 [Google Scholar]
- Richter, P., Fox, A. J., Wakker, B. P., et al. 2013, ApJ, 772, 111 [Google Scholar]
- Richter, P., Wakker, B. P., Fechner, C., et al. 2016, A&A, 590, A68 [NASA ADS] [CrossRef] [EDP Sciences] [Google Scholar]
- Richter, P., Nuza, S. E., Fox, A. J., et al. 2017, A&A, 607, A48 [NASA ADS] [CrossRef] [EDP Sciences] [Google Scholar]
- Richter, P., Winkel, B., Wakker, B. P., et al. 2018, ApJ, 868, 112 [Google Scholar]
- Sameer, Charlton, J. C., Kacprzak, G. G., et al. 2022, MNRAS, 510, 5796 [Google Scholar]
- Sameer, Charlton, J. C., Wakker, B. P., et al. 2024, MNRAS, 530, 3827 [Google Scholar]
- Savage, B. D., & Sembach, K. R. 1991, ApJ, 379, 245 [NASA ADS] [CrossRef] [Google Scholar]
- Savage, B. D., Kim, T.-S., Wakker, B. P., et al. 2014, ApJS, 212, 8 [Google Scholar]
- Shull, J. M. 2014, ApJ, 784, 142 [Google Scholar]
- Stocke, J. T., Keeney, B. A., Danforth, C. W., et al. 2013, ApJ, 763, 148 [Google Scholar]
- Stocke, J. T., Keeney, B. A., Danforth, C. W., et al. 2014, ApJ, 791, 128 [Google Scholar]
- Stocke, J. T., Keeney, B. A., Danforth, C. W., et al. 2019, ApJS, 240, 15 [Google Scholar]
- Tejos, N., Morris, S. L., Crighton, N. H. M., et al. 2012, MNRAS, 425, 245 [Google Scholar]
- Tempel, E., Tamm, A., & Gramann, M. 2014, A&A, 566, A1 [NASA ADS] [CrossRef] [EDP Sciences] [Google Scholar]
- Tully, R. B. 1987, ApJ, 321, 280 [CrossRef] [Google Scholar]
- Tully, R. B. 2015, AJ, 149, 54 [NASA ADS] [CrossRef] [Google Scholar]
- Wakker, B. P., Hernandez, A. K., French, D. M., et al. 2015, ApJ, 814, 40 [Google Scholar]
- Wolfinger, K., Kilborn, V. A., Ryan-Weber, E. V., & Koribalski, B. S. 2016, PASA, 33, 38 [Google Scholar]
- Yun, M. S., Ho, P. T. P., & Lo, K. Y. 1994, Nature, 372, 530 [NASA ADS] [CrossRef] [Google Scholar]
Appendix A: Continuum and absorber modeling
In Fig. A.1, we show as an example the continuum reconstruction and absorption-line modeling for the OGrM absorber at v = 1457 km s−1 in the NGC 1052 group toward the background source NGC 985 (Table 3). The overall continuum in this region between 1218 and 1226 Å (red solid line) has been modeled from a multi-component Voigt-profile fit of the interstellar H I Ly α absorption using the span code (Richter et al. 2013). The slow rise of the continuum level reflects the extended Lorentzian wing of the interstellar Ly α profile. The weak absorber near 1221.5 Å is Ly α at v = 1457 km s−1 in the NGC 1052 group, which resides in the wing of the Galactic interstellar Ly α absorption. It has been modeled with a single absorption component with log N(H I) = 12.50 and b = 19 km s−1. All the absorbers listed in Table 3 have been modeled using a similar approach (see also Sect. 2.3).
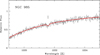 |
Fig. A.1. Example for the absorption-line modeling of the OGrM absorber toward NGC 985 (see also Table 3). |
Appendix B: Radial density distribution in the OGrM absorbers
In Fig. B.1, we show the logarithmic gas density in the OGrM absorbers as a function of the normalized impact parameter to the group center from our hydrostatic toy model (Sect. 4.3). The declining trend for log nH is a direct result of the assumed hydrostatic equilibrium, with each group defining its own gravitational potential according to its mass given in Table 1.
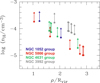 |
Fig. B.1. Logarithmic gas density in the OGrM absorbers as a function of normalized impact parameter from the hydrostatic toy model (Sect. 4.3). |
All Tables
All Figures
|
Fig. 1. Spatial distribution of galaxies in the NGC 1052, NGC 5866, NGC 4631, NGC 3992 galaxy groups together with the galaxies’ (orange-shaded circles) and groups’ (green-shaded circles) virial radii and the position of the selected background AGNs sampled by HST/COS data (red crosses). |
| In the text | |
|
Fig. 2. Velocity plots for H I Ly α absorption for the sightlines passing the outer environment of the NGC 1052 group (lower two panels). OGrM absorbers are marked in dark orange. The expected radial velocity range for OGrM absorption is indicated with the gray-shaded area (see Sect. 2.3). The upper panel shows the velocity distribution for group member galaxies (green histogram) and for all galaxies in the group’s field (gray histogram). |
| In the text | |
|
Fig. 3. Same as Fig. 2, but for the NGC 5866 group. Absorption lines not related to the OGrM or CGM of member and field galaxies are labeled with the star symbol. |
| In the text | |
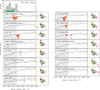 |
Fig. 4. Same as Fig. 2, but for the NGC 4631 group. |
| In the text | |
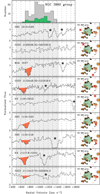 |
Fig. 5. Same as Fig. 2, but for the NGC 3992 group. |
| In the text | |
|
Fig. 6. Spatial configuration of the group member galaxies and the AGN sightlines for the four groups in our sample together with supplementary information. The left panel shows the projected position of group-member galaxies (orange dots) and the AGN sightlines along which OGrM absorption has been detected (black dots). The AGN names are labeled in black, the most important group member galaxies are labeled in gray. The right panel shows the group-member galaxies (orange dots) and the OGrM systems (green triangles) in a 3D position-velocity diagram. |
| In the text | |
|
Fig. 7. Ly α EWs and logarithmic H I column densities of OGrM absorbers plotted against the relative absorber impact parameter to the group center. No clear trend can be seen in these plots. |
| In the text | |
|
Fig. A.1. Example for the absorption-line modeling of the OGrM absorber toward NGC 985 (see also Table 3). |
| In the text | |
|
Fig. B.1. Logarithmic gas density in the OGrM absorbers as a function of normalized impact parameter from the hydrostatic toy model (Sect. 4.3). |
| In the text | |
Current usage metrics show cumulative count of Article Views (full-text article views including HTML views, PDF and ePub downloads, according to the available data) and Abstracts Views on Vision4Press platform.
Data correspond to usage on the plateform after 2015. The current usage metrics is available 48-96 hours after online publication and is updated daily on week days.
Initial download of the metrics may take a while.