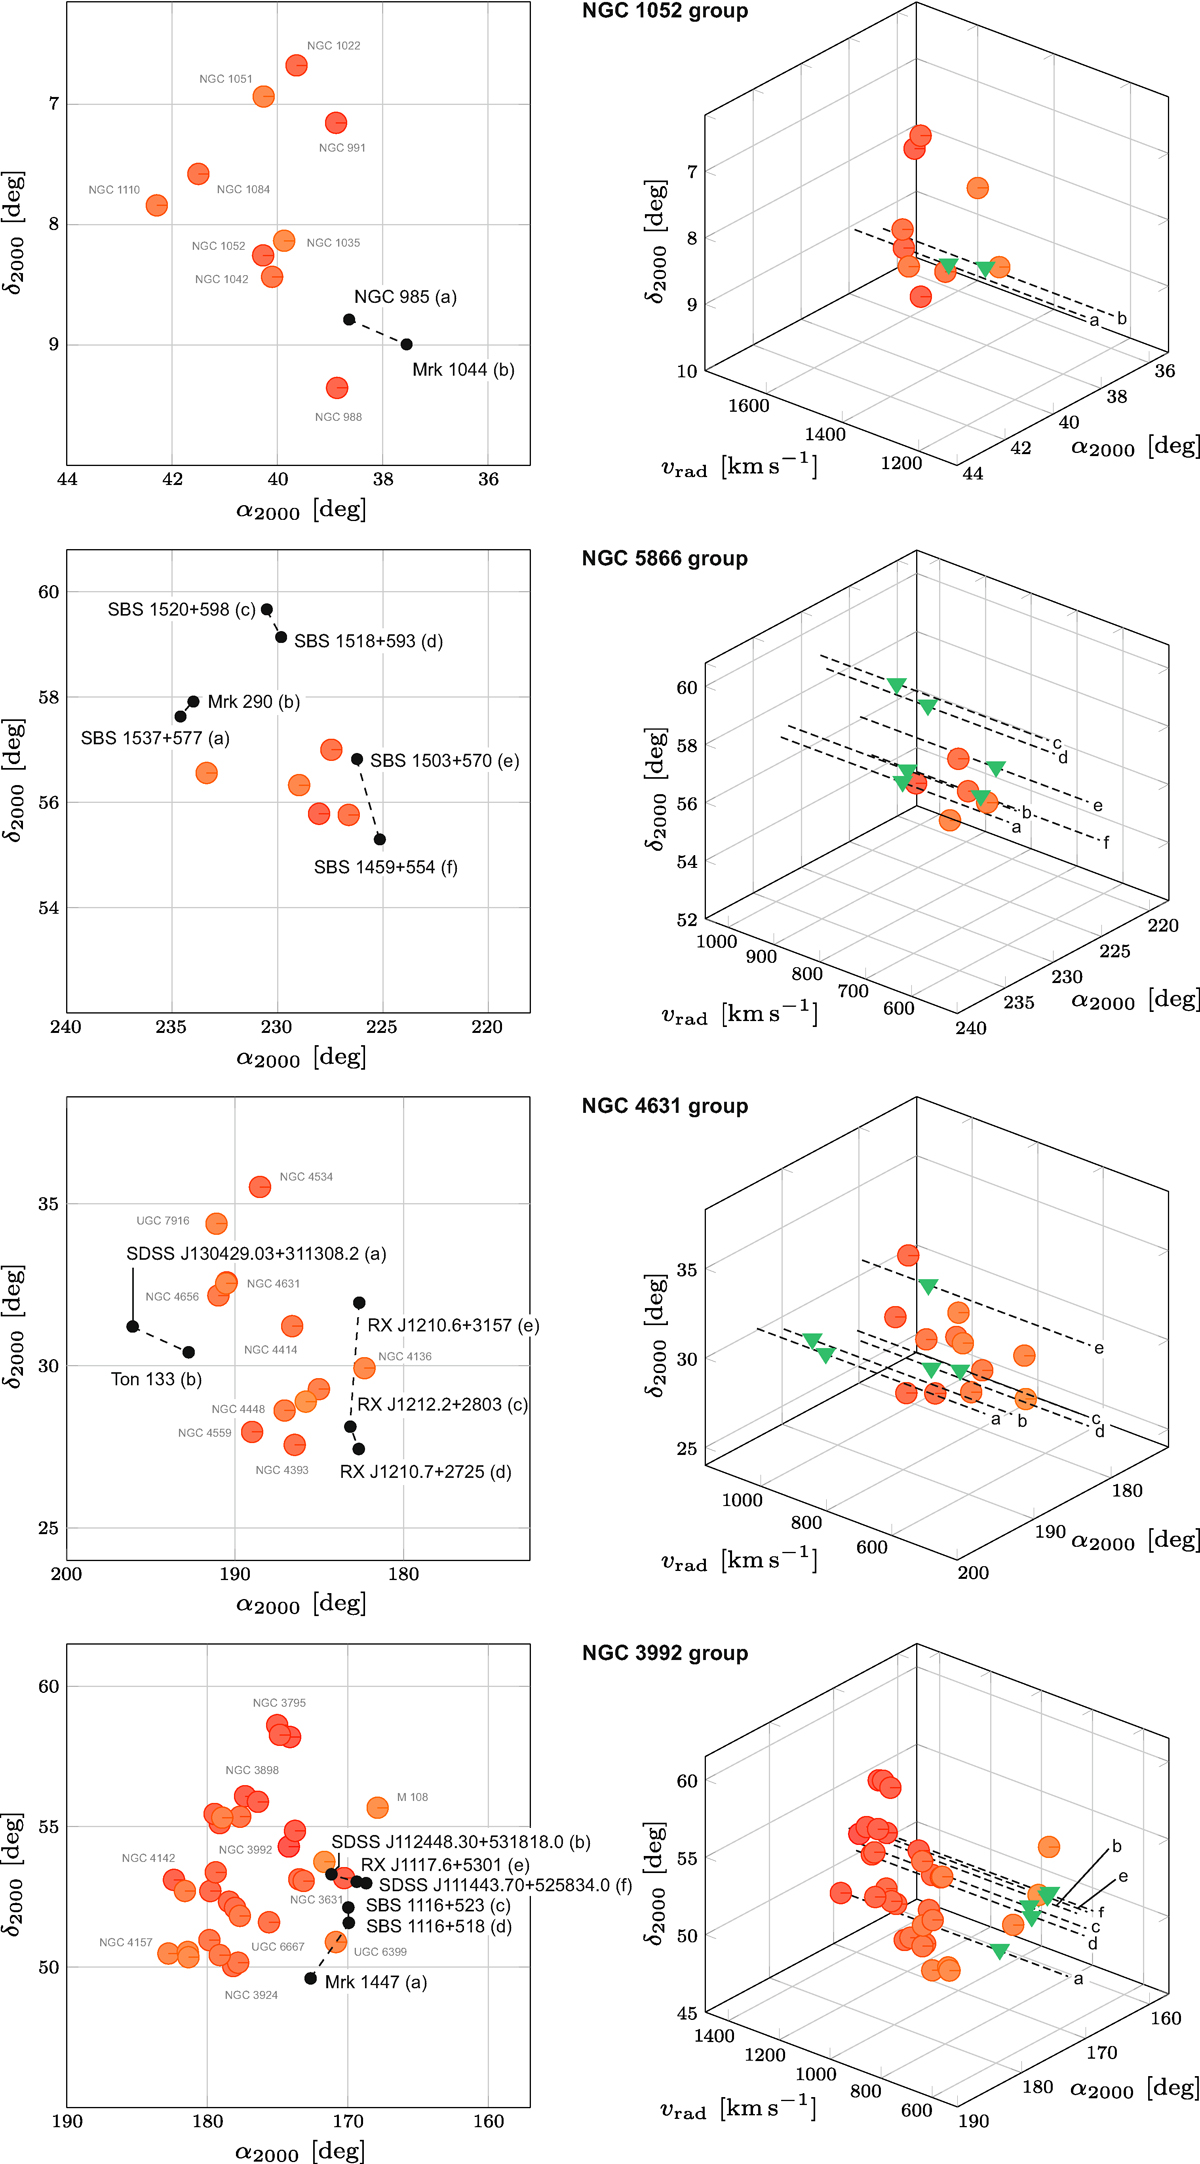
Fig. 6.
Download original image
Spatial configuration of the group member galaxies and the AGN sightlines for the four groups in our sample together with supplementary information. The left panel shows the projected position of group-member galaxies (orange dots) and the AGN sightlines along which OGrM absorption has been detected (black dots). The AGN names are labeled in black, the most important group member galaxies are labeled in gray. The right panel shows the group-member galaxies (orange dots) and the OGrM systems (green triangles) in a 3D position-velocity diagram.
Current usage metrics show cumulative count of Article Views (full-text article views including HTML views, PDF and ePub downloads, according to the available data) and Abstracts Views on Vision4Press platform.
Data correspond to usage on the plateform after 2015. The current usage metrics is available 48-96 hours after online publication and is updated daily on week days.
Initial download of the metrics may take a while.