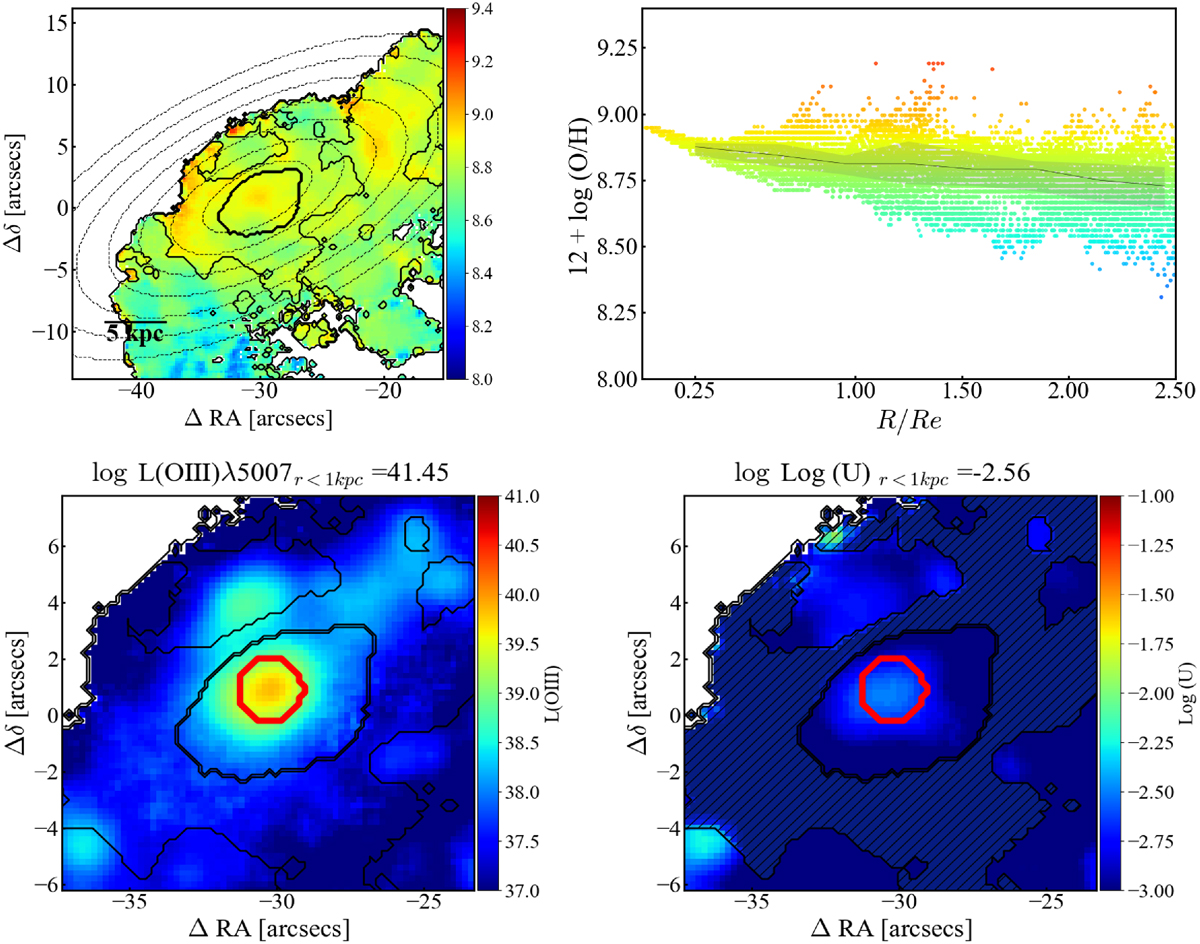
Fig. A.1.
Download original image
Top: Metallicity map (on the left) and metallicity gradient (on the right) of the galaxy ’JO206’ (z = 0.051, logM*/M⊙ = 10.96). Bottom: Spatially resolved map of the luminosity of the [O III]λ5007 line (on the left) and ionization parameter log(U) (on the right). The red circle encloses the aperture with a (non-de projected) radius of ∼ 1 kpc, within which the median values of logL[O III] and logU have been computed; this is also noted. These values are also noted on top of the plots (e.g., logL[O III]r < 1kpc and logUr < 1kpc).
Current usage metrics show cumulative count of Article Views (full-text article views including HTML views, PDF and ePub downloads, according to the available data) and Abstracts Views on Vision4Press platform.
Data correspond to usage on the plateform after 2015. The current usage metrics is available 48-96 hours after online publication and is updated daily on week days.
Initial download of the metrics may take a while.