Fig. 2.
Download original image
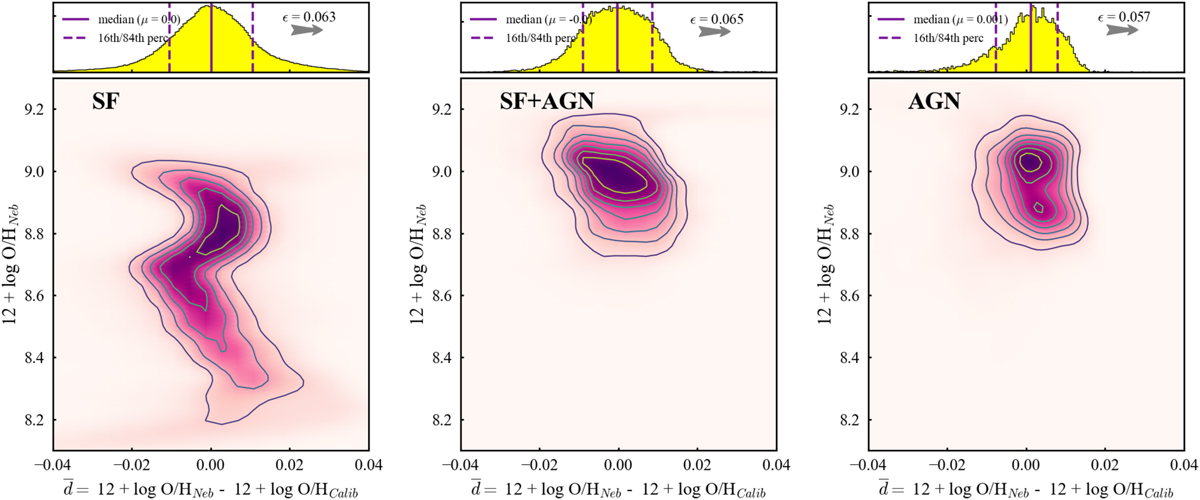
12 + log O/H computed by NEBULABAYES (12 + log O/HNeb) versus the difference ![]() between 12 + log O/HNeb and the metallicities computed through the (from left to right) SF, COMP (AGN+SF), and AGN calibrators (12 + log O/HCal). These distributions have been smoothed by a 2D Gaussian kernel density estimate (KDE), where the black contours outline density curves and darker shades of pink indicate higher densities. ellow histograms on the top panel showcase the distribution of
between 12 + log O/HNeb and the metallicities computed through the (from left to right) SF, COMP (AGN+SF), and AGN calibrators (12 + log O/HCal). These distributions have been smoothed by a 2D Gaussian kernel density estimate (KDE), where the black contours outline density curves and darker shades of pink indicate higher densities. ellow histograms on the top panel showcase the distribution of ![]() along with the 16th and 84th percentiles (purple dotted lines) of the distributions. Values of 12 + log O/HNeb and 12 + log O/HCal are consistent within the errors. Gray arrows point toward the value of the median error on 12 + log O/HNeb (ϵ in top panels), which is outside the range of values shown in the x-axis. This indicates that ϵ is 3× higher than the maximum difference between 12 + log O/HCal and 12 + log O/HNeb.
along with the 16th and 84th percentiles (purple dotted lines) of the distributions. Values of 12 + log O/HNeb and 12 + log O/HCal are consistent within the errors. Gray arrows point toward the value of the median error on 12 + log O/HNeb (ϵ in top panels), which is outside the range of values shown in the x-axis. This indicates that ϵ is 3× higher than the maximum difference between 12 + log O/HCal and 12 + log O/HNeb.
Current usage metrics show cumulative count of Article Views (full-text article views including HTML views, PDF and ePub downloads, according to the available data) and Abstracts Views on Vision4Press platform.
Data correspond to usage on the plateform after 2015. The current usage metrics is available 48-96 hours after online publication and is updated daily on week days.
Initial download of the metrics may take a while.