Fig. 3.
Download original image
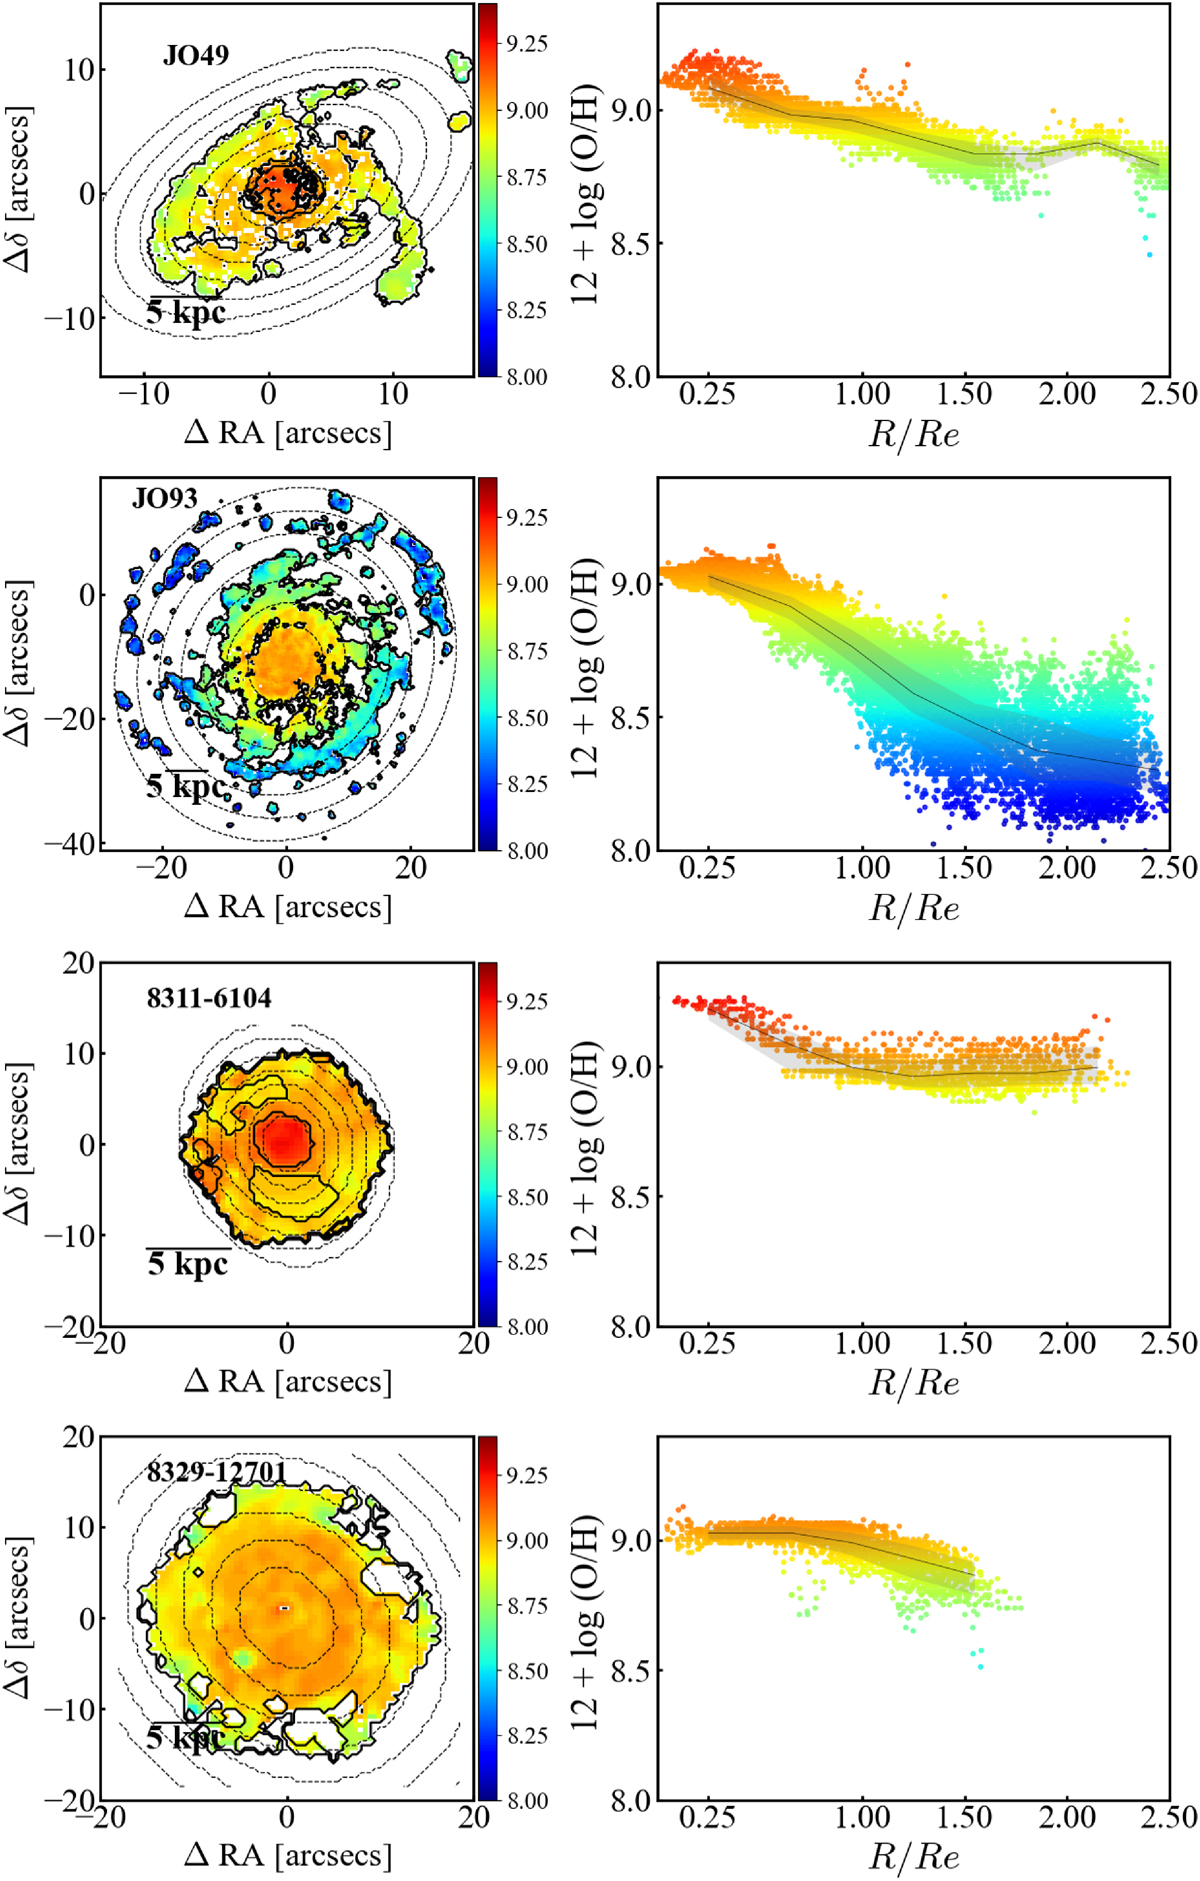
From top to bottom: Metallicity maps (left panels) and metallicity gradients (right panels) of the cluster-AGN host galaxy (JO49, logM* = 10.68, z = 0.0451), cluster-SF galaxy (JO93, logM* = 10.54, z = 0.037), field-AGN galaxy (‘8311-6104’, logM* = 10.67, z = 0.027), and the field-SF galaxy (‘8329-12701’, logM* = 10.99, z = 0.035), shown from top to bottom. On the left: Black contours are overplotted on the metallicity map to divide the SF, composite, and AGN-like regions, as classified by the [N II]– BPT. The gray dotted ellipses are the annuli that cover the galaxy up to Re ∼ 2.5, proceeding with a step of 0.3 dex, except for the central annulus, which has an inner radius of rin = 0Re and an outer radius of rout = 0.5Re. Inside each annulus, the median value of the 12 + log O/H distribution is computed, along with the 25th and 75th percentiles, considering all the 12 + log O/H values inside the SF, composite, and AGN spaxels. On the right: Metallicity profile (gray line) is, obtained by joining the median values of 12 + log O/H of each annulus, plotted versus the mean value of R/Re inside a given annulus, and t(gray line). The shaded area that covers the range of 12 + log O/H values within the 25th and 75th percentiles. In both panels, the color coding is set according to the value of 12 + log O/H, ranging from 8.0 to 9.4.
Current usage metrics show cumulative count of Article Views (full-text article views including HTML views, PDF and ePub downloads, according to the available data) and Abstracts Views on Vision4Press platform.
Data correspond to usage on the plateform after 2015. The current usage metrics is available 48-96 hours after online publication and is updated daily on week days.
Initial download of the metrics may take a while.