Fig. 9.
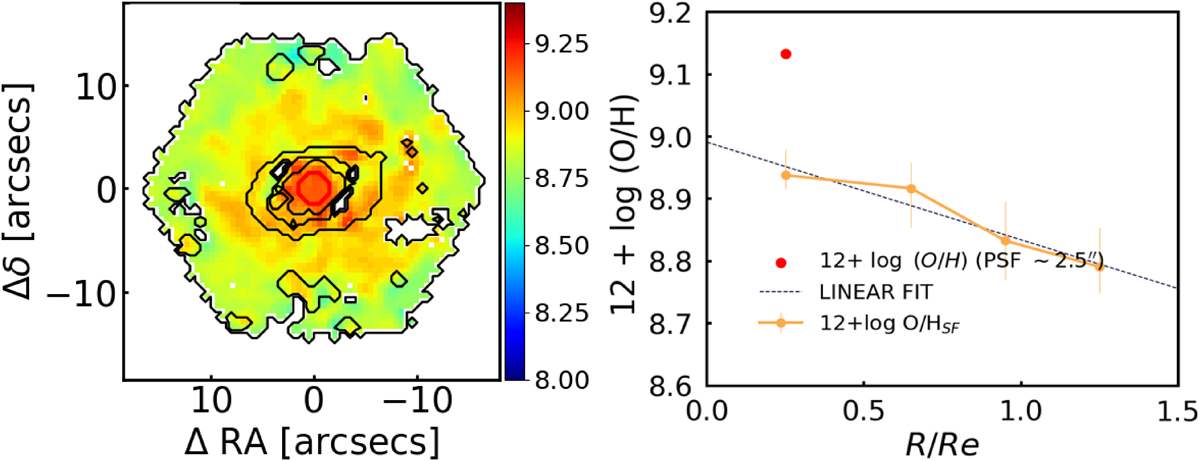
Download original image
Left: Metallicity map of the AGN-host galaxy ‘8985-12703’ in MaNGA, which is a galaxy in common with the sample studied in Nascimento et al. (2022). The red circle is the MaNGA PSF, e.g., an aperture with diameter d ∼ 2.5′′. Right: Metallicity gradient for the same galaxy. The yellow line traces the median metallicity gradient if only SF spaxels are considered, while the red dot is the median 12 + log O/H inside the MaNGA PSF among all the spaxels (AGN, composite, and SF). Thus, the red dot traces the metallicity in the AGN-dominated region, while the orange gradient shows the metal content of the HII regions in the galaxy’s disk. The black dotted line is the linear fit of the observed HII gradient, obtained with an non-linear least square method. This figure is adapted in order to resemble Figure 3 in Nascimento et al. (2022).
Current usage metrics show cumulative count of Article Views (full-text article views including HTML views, PDF and ePub downloads, according to the available data) and Abstracts Views on Vision4Press platform.
Data correspond to usage on the plateform after 2015. The current usage metrics is available 48-96 hours after online publication and is updated daily on week days.
Initial download of the metrics may take a while.