Fig. 13
Download original image
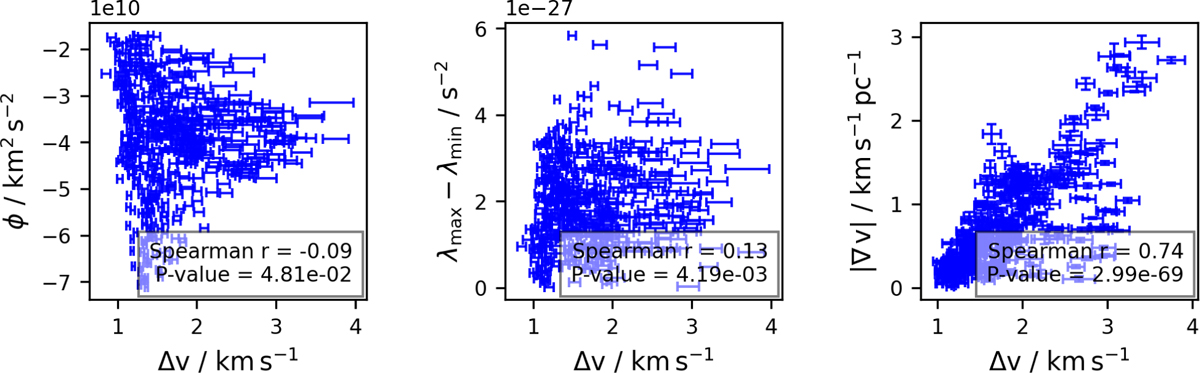
Correlation between the line width and gravitational potential (left panel), λmax – λmin (middle panel), and velocity gradient (right panel) in the G53W region. λmax – λmin can characterize the degree of deformation of the gas due to tidal forces. The calculation of λmax and λmin is provided in Sect. 7. The Spearman correlation coefficient and p-value are labeled in the bottom-right corner of each panel. Note that each data point corresponds to a single pixel. Native pixels are not independent, due to beam convolution.
Current usage metrics show cumulative count of Article Views (full-text article views including HTML views, PDF and ePub downloads, according to the available data) and Abstracts Views on Vision4Press platform.
Data correspond to usage on the plateform after 2015. The current usage metrics is available 48-96 hours after online publication and is updated daily on week days.
Initial download of the metrics may take a while.