Fig. C.1
Download original image
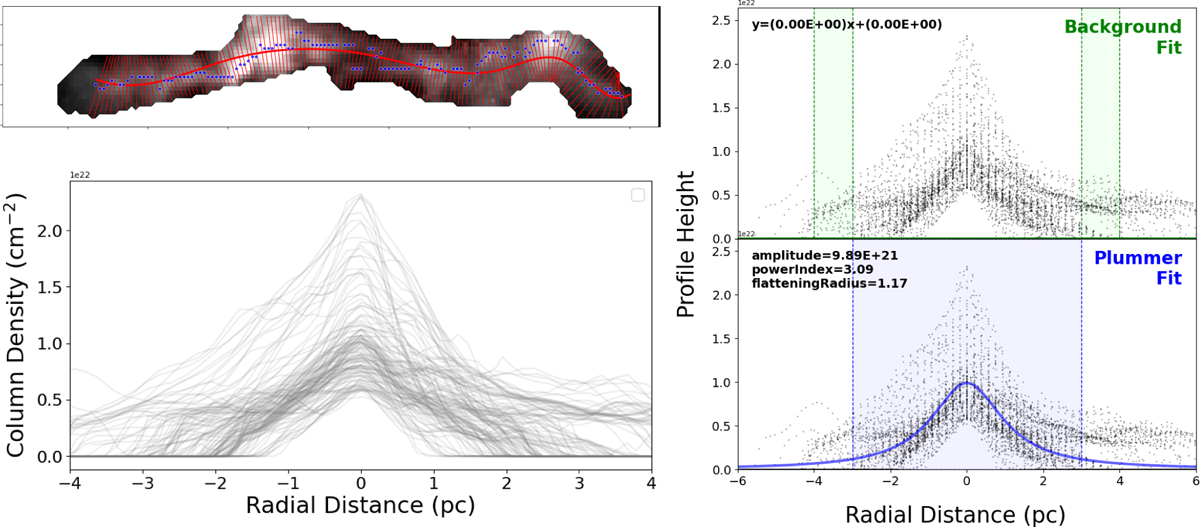
Top left: Underlying column density of the filament within the spine mask (background grayscale). The thick red line is the smoothed spine of the filament. The perpendicular red cuts are taken tangent to the smoothed spine. The peak column densities along the cut are marked via the blue scatter points. Bottom left: Column density profile along every cut. Right: Background fitting (top) and plummer fitting (bottom) result.
Current usage metrics show cumulative count of Article Views (full-text article views including HTML views, PDF and ePub downloads, according to the available data) and Abstracts Views on Vision4Press platform.
Data correspond to usage on the plateform after 2015. The current usage metrics is available 48-96 hours after online publication and is updated daily on week days.
Initial download of the metrics may take a while.