Fig. 2
Download original image
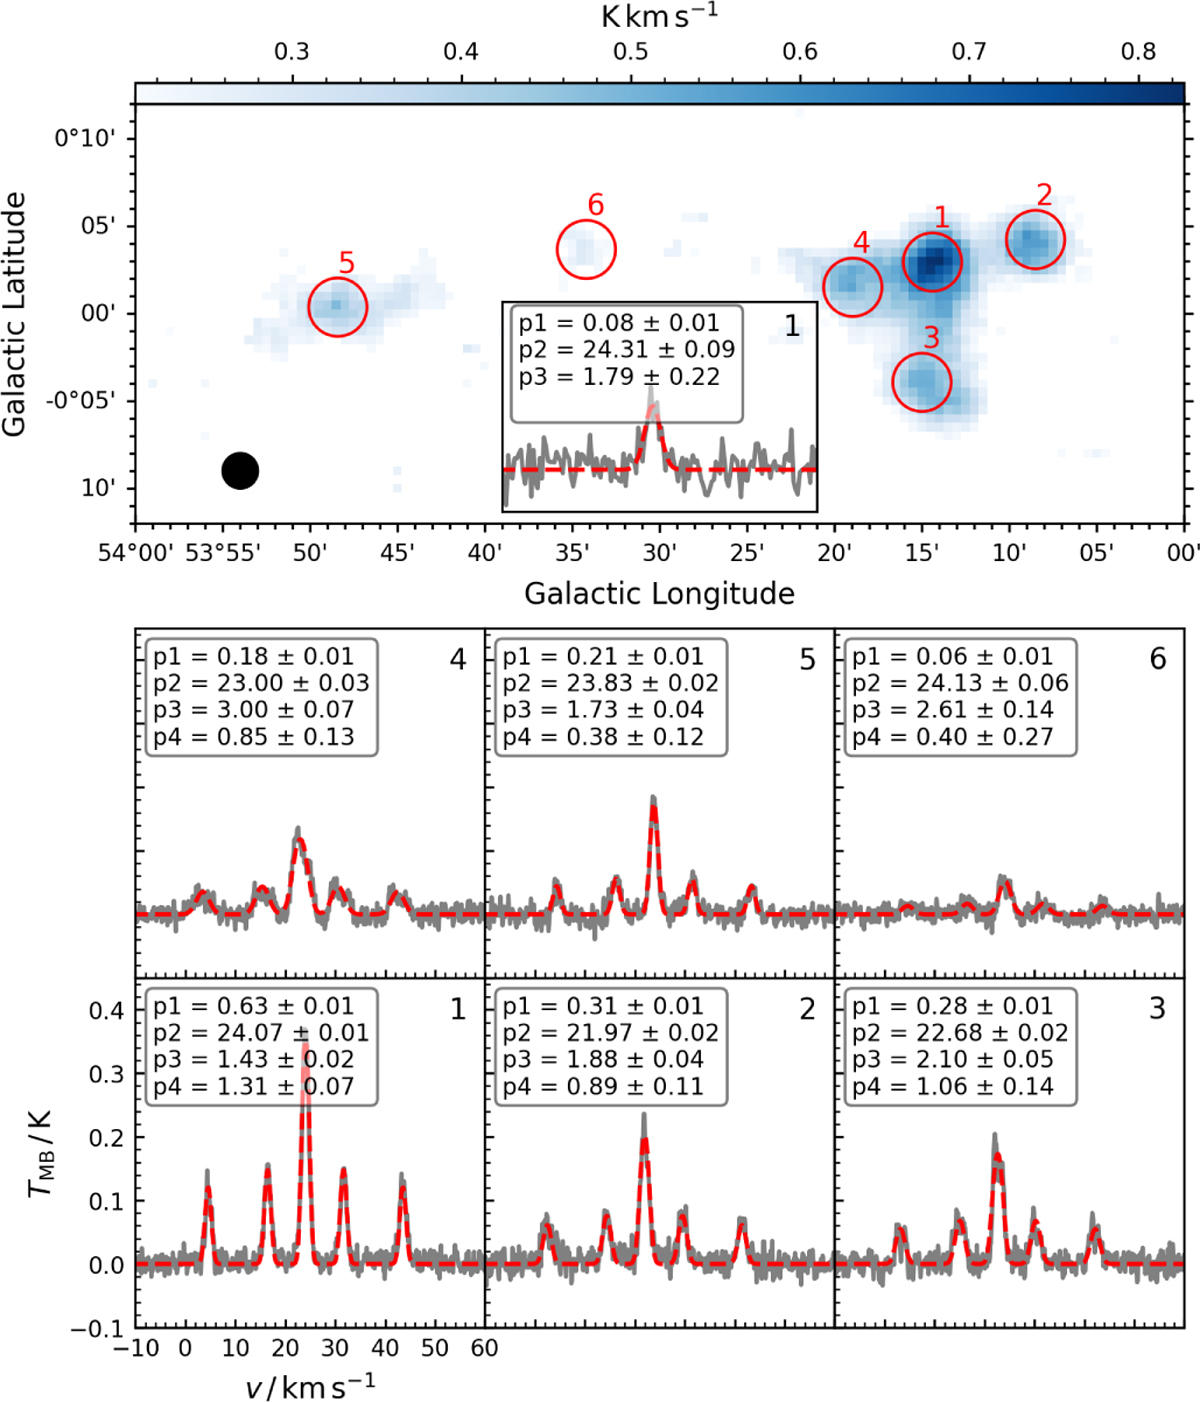
Map and spectral lines of the NH3 (1,1). Top panel: velocity-integrated intensity map of the NH3 (1,1) main group of hyperfine components with an integration range of 20–26 km s–1. Six red circles mark the six main regions; each circle has a diameter of 3.33′. The inset shows the NH3(2,2) spectrum of Region 1. The p1, p2, and p3 represent the peak intensity in K, the line center velocity in km s–1, and the line width in km s–1, respectively. The black circle in the lower-left corner represents the beam size. Bottom panel: Ammonia (1,1) spectra for the six regions. The p2, p3, and p4 represent the line center velocity (Vlsr) in km s–1, the line width (ΔV) in km s–1, and the main group peak optical depth (τmain), respectively. p1 = A0 × τmain, where A0 is an arbitrary amplitude in units of K. Although A0 is an arbitrary amplitude, when τmain ≪ 1, A0 corresponds to the main group peak intensity.
Current usage metrics show cumulative count of Article Views (full-text article views including HTML views, PDF and ePub downloads, according to the available data) and Abstracts Views on Vision4Press platform.
Data correspond to usage on the plateform after 2015. The current usage metrics is available 48-96 hours after online publication and is updated daily on week days.
Initial download of the metrics may take a while.