Fig. 5
Download original image
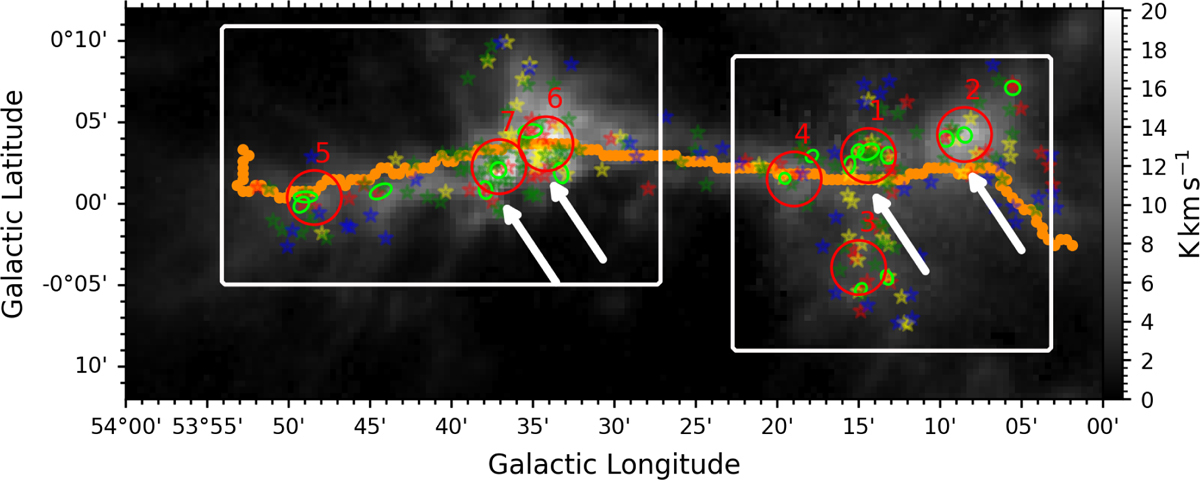
Sky-projected filament spine. The background is the 13CO velocity-integrated intensity map. The orange corresponds to the sky-projected spine extracted by CRISPY. The lime ellipses represent dust cores from the ATLASGAL survey. The star markers in different colors represent YSOs at different stages: Class I (red), flat spectrum (yellow), Class II (green), and Class III (blue). The region marked with a red circle is the area of interest to us, where regions 1, 2, and 6 are labeled the same as in the top panel of Fig. 2, and region 7 is an additional region based on the top panel of Fig. 2. Region 7 shows a signal in CO and the Herschel H2 column density map, but no signal in NH3. White arrows indicate the positions of the end clumps in G53W and G53E. In G53W, the end clumps are located in regions 1 and 2, while in G53E, the end clumps are found in regions 6 and 7, as clearly depicted in the Herschel H2 column density map (shown in Figs. 7 and D.1).
Current usage metrics show cumulative count of Article Views (full-text article views including HTML views, PDF and ePub downloads, according to the available data) and Abstracts Views on Vision4Press platform.
Data correspond to usage on the plateform after 2015. The current usage metrics is available 48-96 hours after online publication and is updated daily on week days.
Initial download of the metrics may take a while.