Fig. 7
Download original image
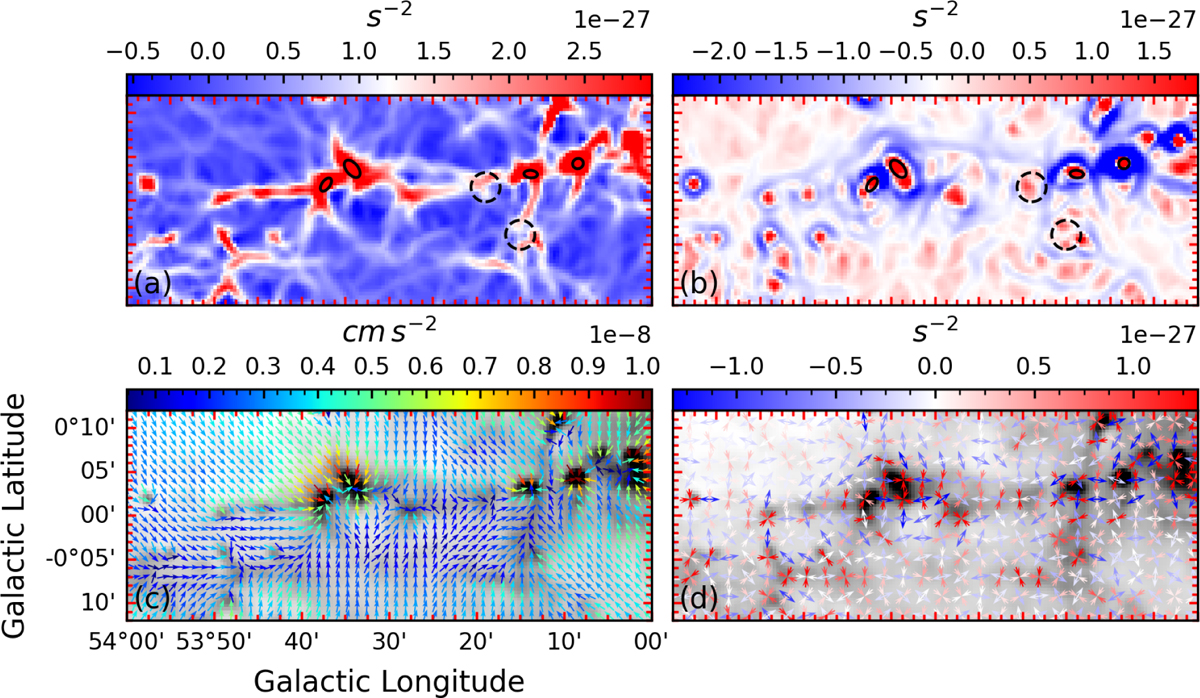
Panels a and b: maps of the eigenvalues of the tidal tensor λmax and λmin (refer to Sect. 3.4) toward G53. The solid black ellipses represent C1, C3, C2, and C4 from left to right. The dashed black circles represent regions 4 and 3 from left to right. Panel c: Herschel H2 column density. Thee color and direction of the arrows indicate the magnitude and direction of the gravitational field. Panel d: same as panel c but with two opposing arrows in one direction indicating that the gas in this pixel is collapsing along the corresponding directions, while two arrows pointing away from each other indicate the gas in this pixel is expanding along the corresponding directions.
Current usage metrics show cumulative count of Article Views (full-text article views including HTML views, PDF and ePub downloads, according to the available data) and Abstracts Views on Vision4Press platform.
Data correspond to usage on the plateform after 2015. The current usage metrics is available 48-96 hours after online publication and is updated daily on week days.
Initial download of the metrics may take a while.