Fig. 9
Download original image
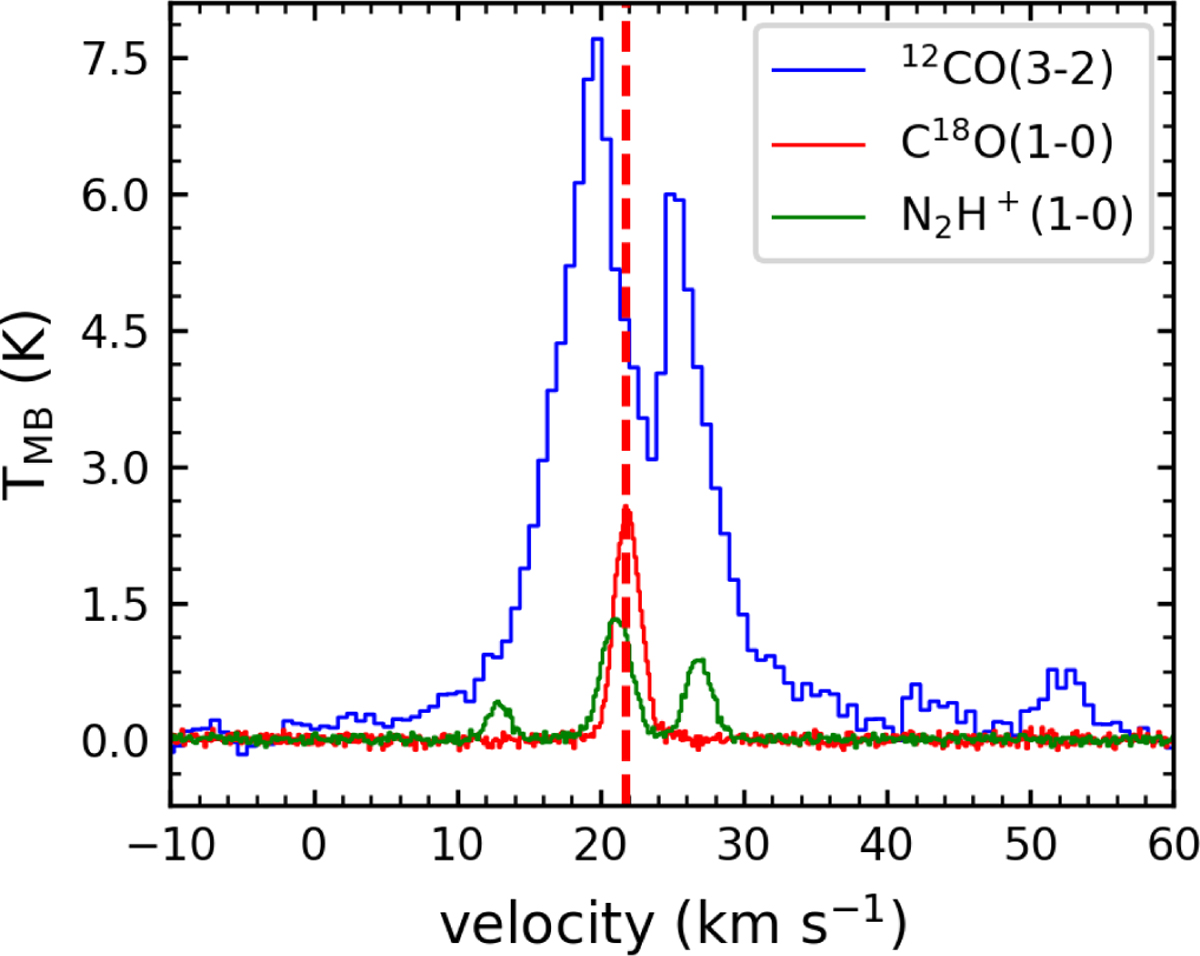
Averaged spectra of different molecules in clump C4, calculated from the regions indicated by the red elliptical area in Fig. D.1. This includes in blue the 12CO (3–2), in red the C18O (1–0), and in green the N2H+ (1–0) transitions. The C18O (1–0) and N2H+ (1–0) data were obtained from Zhang et al. (2017) using observations from the IRAM 30 m telescope. Note that the condition for generating a blue-red asymmetry spectrum is that the cloud must exhibit a central condensation of material. We assumed that clump C4 satisfies this condition.
Current usage metrics show cumulative count of Article Views (full-text article views including HTML views, PDF and ePub downloads, according to the available data) and Abstracts Views on Vision4Press platform.
Data correspond to usage on the plateform after 2015. The current usage metrics is available 48-96 hours after online publication and is updated daily on week days.
Initial download of the metrics may take a while.