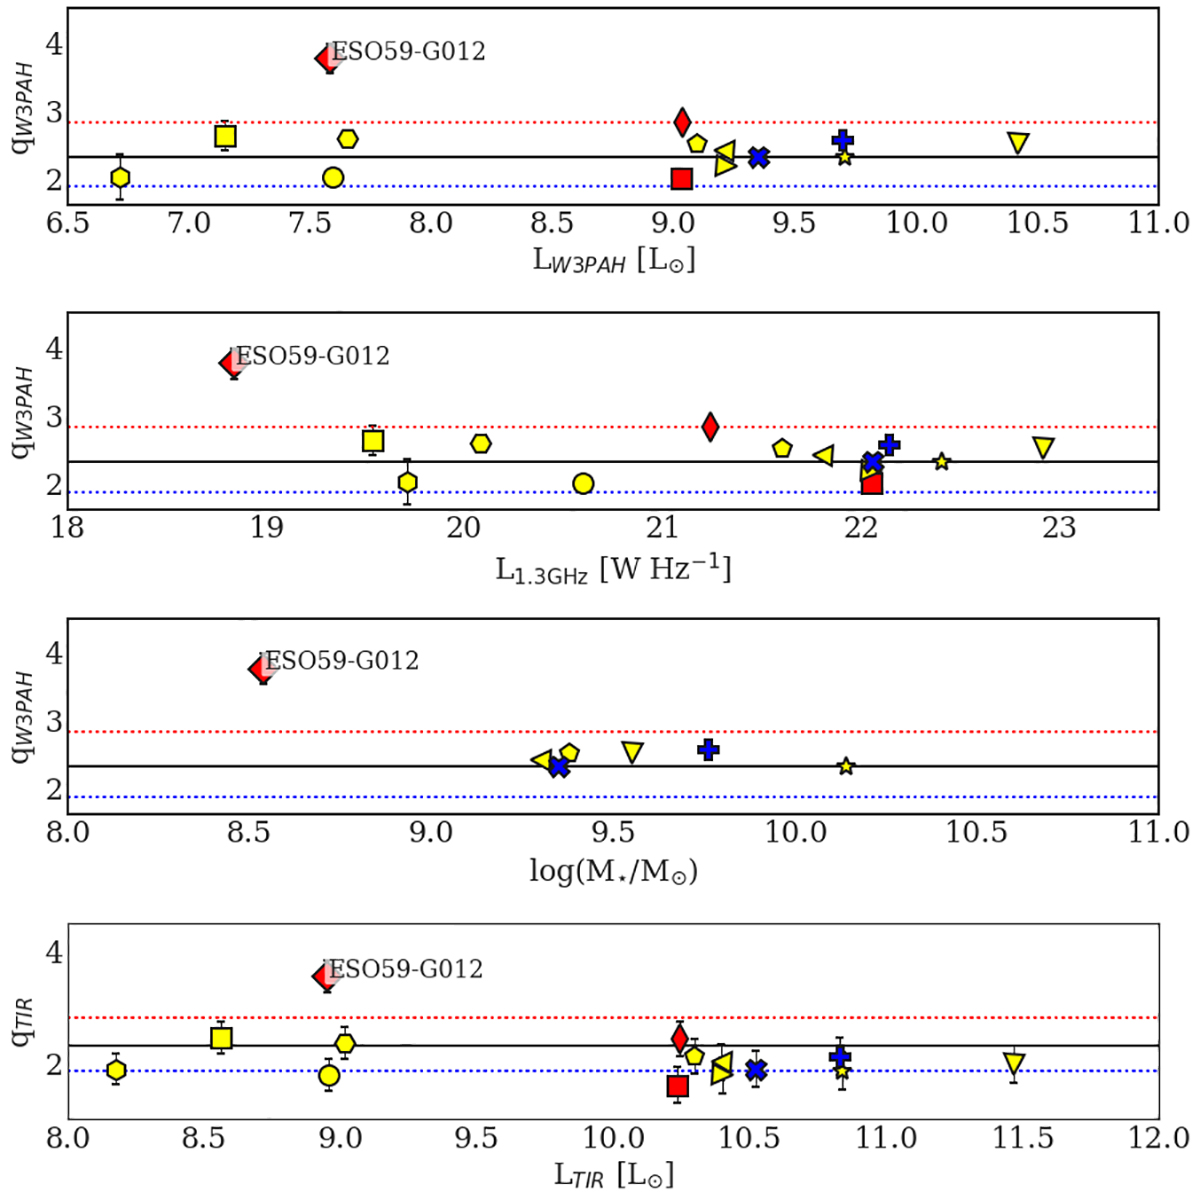
Fig. D.2.
Download original image
The qW3PAH value as a function of W3PAH, 1.3 GHz luminosity, stellar mass, and qTIR vs TIR luminosity. Error bars are displayed for each object unless smaller than the symbol. Except for the errors in the mass determination, which are not shown. The solid line is the same as in Yun et al. (2001)q = 2.34. The blue and red dotted lines show the value corresponding to three times larger radio and W3PAH flux density than expected.
Current usage metrics show cumulative count of Article Views (full-text article views including HTML views, PDF and ePub downloads, according to the available data) and Abstracts Views on Vision4Press platform.
Data correspond to usage on the plateform after 2015. The current usage metrics is available 48-96 hours after online publication and is updated daily on week days.
Initial download of the metrics may take a while.