| Issue |
A&A
Volume 701, September 2025
|
|
|---|---|---|
| Article Number | A87 | |
| Number of page(s) | 20 | |
| Section | Extragalactic astronomy | |
| DOI | https://doi.org/10.1051/0004-6361/202453465 | |
| Published online | 03 September 2025 | |
MeerKAT radio continuum imaging of nearby star-forming spirals in the NGC 6221, NGC 3256/3263, and NGC 2434 galaxy groups
1
Instituto Argentino de Radioastronomía, CONICET-CICPBA-UNLP, CC5 (1897) Villa Elisa, Prov. de Buenos Aires, Argentina
2
Australia Telescope National Facility (ATNF), CSIRO, Space and Astronomy, P.O. Box 76 Epping, NSW 1710, Australia
3
School of Science, Western Sydney University, Locked Bag 1797, Penrith, NSW 2751, Australia
4
Department of Physics and Astronomy, University of Manitoba, Winnipeg, Manitoba R3T 2N2, Canada
5
Departamento de Astronomia, Instituto de Astronomia, Geofísica e Ciências Atmosféricas da USP, Cidade Universitária, 05508-090 São Paulo, SP, Brazil
⋆ Corresponding author: This email address is being protected from spambots. You need JavaScript enabled to view it.
Received:
16
December
2024
Accepted:
14
July
2025
Abstract
Context. We present high-resolution MeerKAT 1.3 GHz radio continuum images of star-forming spirals in the nearby galaxy groups around NGC 6221, NGC 3256/3263, and NGC 2434. This sample spans the evolutionary timeline for galaxy groups, encompassing early, intermediate, and late stages, respectively. The NGC 6221 group contains an interacting galaxy pair with tidal debris, along with at least three dwarf galaxies. In contrast, the NGC 3256/3263 group represents a loose group consisting of several spiral as well as dwarf galaxies, while a massive elliptical galaxy dominates the NGC 2434 group.
Aims. We study the star formation activity in all detected galaxies as it is one of the dominant physical processes in their formation and evolution, seeking evidence of environmental impact.
Methods. We used MeerKAT radio continuum data and archival WISE infrared data to locate and measure the star formation rate in all group members. In particular, we used polycyclic aromatic hydrocarbons (PAHs) as tracers of gas heated due to star formation activity. Furthermore, we created in-band spectral index maps, providing insights into the underlying physical processes associated with the detected star-forming regions. For some galaxies, we also determined key stellar properties such as age and mass through SED fittings.
Results. We found that galaxies are distributed differently in the WISE colour-colour diagram depending on their evolutionary group stage, as was expected. Except for ESO 059-G012, the galaxies in our sample follow the radio-W3PAH correlation. A possible scenario that explains the ESO 059-G012 result is that the galaxy has already consumed the gas. We also found evidence that the interaction among the spiral galaxies NGC 3263, NGC 3256B, and NGC 3256C is causing the Vela Cloud complex and that the galaxies NGC 6221 and NGC 3256 might host a low-luminosity active galactic nucleus, as was previously proposed in the literature.
Key words: galaxies: evolution / galaxies: groups: individual: NGC 6221 / galaxies: groups: individual: NGC 3256/3263 / galaxies: groups: individual: NGC 2434 / galaxies: star formation / radio continuum: galaxies
© The Authors 2025
 Open Access article, published by EDP Sciences, under the terms of the Creative Commons Attribution License (https://creativecommons.org/licenses/by/4.0), which permits unrestricted use, distribution, and reproduction in any medium, provided the original work is properly cited.
This article is published in open access under the Subscribe to Open model. This email address is being protected from spambots. You need JavaScript enabled to view it. to support open access publication.
1. Introduction
The radio continuum emission detected in galaxies combines thermal and non-thermal emission. Both processes are typically associated with massive star formation. Star formation is the main internal physical process in the formation and evolution of galaxies. At gigahertz frequencies, the radio continuum emission is optically thin and is a tracer of recent star formation, unbiased by dust within galaxies (Condon 1992; Davies et al. 2017). Thermal emission is produced by free-free emission from the ionised gas, while the non-thermal component is produced by synchrotron radiation caused by cosmic-ray electrons with giga-electronvolt energies spiralling in the magnetic field of a galaxy. These electrons are primarily accelerated in the star-forming region’s shock fronts of supernova explosions or stellar winds. Most optical or ultraviolet indicators of the star formation rate (SFR) in galaxies are either indirect tracers of young stars or affected by dust extinction. The ultraviolet light from young, fairly massive stars (> 5 M⊙) also ionises the surrounding hydrogen gas cloud, producing thermal radio emission and heating the nearby dust, which re-radiates in the infrared regime. Thus, assuming that infrared and radio emissions are both connected to massive stars, and therefore to star formation, the characteristics mentioned above underlie the basis for the infrared-radio correlation (Helou et al. 1985; Condon 1992; Yun et al. 2001; Bell et al. 2003). Different studies were conducted to understand this correlation better, from a detailed analysis of individual galaxies (e.g. NGC 6946, Tabatabaei et al. 2013) to a statistical analysis of many galaxies (Shao et al. 2018; Grundy et al. 2023) and also considering galaxies at different redshifts (Seymour et al. 2009; Basu et al. 2015; Delhaize et al. 2017; Yoon 2024). Sometimes, it is observed that the infrared-radio relationship is not tight when considering interacting or merging galaxies. For example, an excess of radio emission was found in the case of the so-called Taffy system, a pair of interacting galaxies with a strong synchrotron-emitting gas bridge between them (Condon et al. 2002). Murphy (2013) suggested that the excess in non-thermal emission is probably due to particle acceleration in large-scale shocks in bridges between interacting galaxies (Lisenfeld & Völk 2000). Moreover, Donevski & Prodanović (2015) studied the possibility of such a departure in the relation not only due to the bridges and in ‘Taffy’ systems but also from cosmic rays accelerated in tidal shocks in the galaxies themselves. Then, deviations from the expected infrared-radio relation can show how galaxy-galaxy interactions or interactions between galaxies and the intra-cluster or group medium affect the gaseous and relativistic phases of their interstellar medium (Condon et al. 2002; Murphy et al. 2009; Murphy 2013; Donevski & Prodanović 2015). Several authors have investigated the non-linearity of the infrared–radio correlation, exploring its dependence on radio and infrared luminosities, stellar mass, and redshift. Molnár et al. (2021) conducted a study focusing on galaxies at low redshifts (z < 0.2), distinguishing between star-forming galaxies (SFGs) and active galactic nuclei (AGNs). They found that galaxies with higher radio luminosities (![Mathematical equation: $ \log\,L_{1.4\,\rm GHz}\,[\mathrm{W\,Hz}^{-1}] \geq 22.5 $](/articles/aa/full_html/2025/09/aa53465-24/aa53465-24-eq1.gif) ) exhibit stronger radio emission compared to the infrared. Delvecchio et al. (2021) examined potential dependencies of the infrared-radio correlation on stellar mass and redshift. Their results show that for a given SFR, more massive galaxies emit more strongly in the radio than in the infrared.
) exhibit stronger radio emission compared to the infrared. Delvecchio et al. (2021) examined potential dependencies of the infrared-radio correlation on stellar mass and redshift. Their results show that for a given SFR, more massive galaxies emit more strongly in the radio than in the infrared.
We obtained single-pointing MeerKAT 1.3 GHz observations of three nearby galaxy groups (around the galaxy NGC 6221, galaxies NGC 3256 and NGC 3263, and galaxy NGC 2434) known to contain widespread tidal debris and sampling the evolutionary timeline of groups (e.g. Verdes-Montenegro et al. 2001). In the first group, the pair-wise interactions between the two dominant spirals, NGC 6215 and NGC 6221, resulted in an extended H I bridge (Koribalski & Dickey 2004). In contrast, the second group is a loose association of galaxies around NGC 3256 and NGC 3263, where members pre-process via pair-wise interactions as they begin to fall towards the group’s centre of mass. Among the widespread tidal debris is the large Vela H I cloud (English et al. 2010). The third group, named after the central elliptical galaxy NGC 2434, represents the end of the evolutionary sequence for groups; the group members appear to be in the process of accreting onto this central object (Ryder et al. 2001).
We aim to map the SFR in the group members, described in Appendix A, using our MeerKAT radio continuum data, unobscured by dust, along with supplemental high-angular-resolution WISE data, and to find evidence of an environmental impact on star formation activity. The following subsections introduce the galaxy groups, followed by a description of the MeerKAT observations and ancillary data in Section 2. The results are presented in Section 3, followed by our discussion in Section 4. A summary is provided in Section 5.
2. Observations and data processing
2.1. MeerKAT observations and data processing
MeerKAT is a powerful radio interferometer located in the Karoo desert of South Africa, consisting of 64 dishes with baselines out to 8 km (Jonas 2009; Jonas & MeerKAT Team 2016; Mauch et al. 2020). The parabolic 13.5 m diameter antennas have offset Gregorian receivers. Of the 64 antennas, 48 are located in the inner core (within a 1 km radius), providing the shortest baseline of 29 m. Spectral line and radio continuum observations of three nearby galaxy groups (project SCI-20210212-BK-01) were carried out during 2021 and 2022 (see Table B.1). Here we present the radio continuum data for which we used a centre frequency of 1.3 GHz and a bandwidth of 856 MHz. The latter was divided into 10 channels for the in-band spectral analysis of the radio continuum emission. The resulting frequency range is 856 to 1712 MHz. The primary calibrators were PKS 1934–638 and PKS 0408–658 with total 1.3 GHz intensities of 15.0 Jy and 15.7 Jy, respectively. The target field and the secondary calibrator were observed alternately for 36 min and 2 min, respectively.
The MeerKAT radio continuum data processing was done by SARAO using the continuum and H I pipeline CARACal1, which has been extensively tested and optimised for MeerKAT data (Józsa et al. 2020a,b). For the NGC 3263 field, we used the combined data from two ∼5 h observations, described in Koribalski et al. (2024), along with the processing procedure. The achieved angular resolutions and root-mean-square (rms) sensitivities are listed in Table B.1 together with the observing parameters. The data analysis was done using MIRIAD software tasks. The MeerKAT observing parameters are listed in Table B.1, and the high-resolution radio continuum images of the remaining galaxies detected within the three galaxy groups are displayed in Figures 1 and C.1.
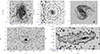 |
Fig. 1. High-resolution MeerKAT 20-cm radio continuum emission of five galaxies overlaid onto DSS optical images. First row: NGC 6221, NGC 6215, and NGC 2442. The radio continuum contour levels of NGC 6221 and NGC 6215 are 0.03, 0.2, 0.5, 1, 3, and 8 mJy beam−1, while for NGC 2442, the levels are 0.027, 0.09, and 0.27 mJy beam−1. Second row: NGC 3256 and NGC 3263. The radio continuum contour levels are 0.027, 0.045, 0.18, 0.45, 0.9, 2.7, and 7.2 mJy beam−1. Contours are shown in black or white for display purposes. The synthesised beam is displayed in the bottom left corner of each panel. |
2.2. WISE ancillary data
The three galaxy groups were observed with the Wide-field Infrared Survey Explorer (WISE, Wright et al. 2010). During this mission, the sky was mapped at 3.4, 4.6, 12, and 22 μm (W1, W2, W3, and W4) with angular resolutions of 6.1″, 6.4″, 6.5″, and 12.0″, respectively. We gathered WISE images from the NASA/IPAC Infrared Science Archive (IRSA). We measured the integrated WISE W1, W2, and W3 band flux densities for our galaxy sample, because the high angular resolution makes them useful for analysing resolved properties. The procedure was performed using PHOTUTILS (Bradley et al. 2016, 2020), an Astropy-affiliated photometry package written in Python. The tool has functions such as detecting astronomical target sources, evaluating the backgrounds of astronomical images, and performing aperture photometry. We explain the procedure in Section 3.2.
3. Results
3.1. Radio continuum
We detected radio continuum emission from several spiral galaxies in all three groups and measured their flux densities using standard procedures (see Table 1, and Figs. 1 and C.1). In the NGC 6221 group, we detected radio continuum emission from the galaxies NGC 6221 and NGC 6215; see Table 1. No radio continuum emission was detected from the three gas-rich dwarf galaxies catalogued by Koribalski & Dickey (2004), or from the H I bridge or the H I clumps. Considering a point-source distribution, we estimate an upper limit on their flux densities of ∼35μJy (5σ). Furthermore, three background galaxies were detected in this field: ESO 138-G001, ESO 138-G004, and ESO 138-G005 (see Fig. C.1). Fig. 1 shows the high-resolution radio continuum images of the NGC 6221/6215 galaxy pair.
Radio continuum and infrared properties of the detected galaxies.
In the NGC 3256/3263 group, we detected radio continuum emission from eight out of ten galaxies proposed as members by Kourkchi & Tully (2017) (see Table 1). No continuum emission was detected towards the Vela Cloud and any other H I debris within the group. We consider the galaxies ESO 263-44 and ESO 263-46 to be group members, despite the fact that they have usually not been included in previous studies, because their systemic velocity agrees with a moderate group velocity dispersion (< 300 km s−1). Furthermore, we detected three background galaxies: ESO 263-45, LEDA 3097821, and LEDA 087403. In Fig. 1, we present the high-resolution radio continuum images of NGC 3256 and NGC 3263. The remaining galaxies, along with the background galaxies, are displayed in Fig. C.1.
In the NGC 2434 galaxy group, we detected four out of twelve galaxies proposed as members by Kourkchi & Tully (2017). The group members NGC 2397 (detected) and NGC 2397B lie on the outskirts of the primary beam; see Table 1 for further information. No continuum emission is detected towards the H I debris described in Koribalski & Dickey (2004). The high-resolution radio continuum image of NGC 2442 is depicted in Fig. 1, while the continuum of the other three detected galaxies can be seen in Fig. C.1.
3.2. Mid-infrared photometry
To obtain accurate photometric measurements of the sampled galaxies, we first had to locate and catalogue the sources in the images. Then, we had to identify the pixels in the images that belong to each source to create a mask. This mask would help us to exclude the light profile from neighbouring objects. Hence, we used the photometry routine PHOTUTILS (Bradley et al. 2016, 2020).
We produced the catalogues and segmentation maps for the masks using the DETECT_SOURCES and SOURCECATALOG functions to separate the target galaxy from its neighbours. To do this, we first smoothed the W1 band image with a Gaussian kernel of 3 × 3 and then segmented this image. We also used the W1 band, which covers a larger area, to choose which segments to use for the W2 and W3 bands in order to avoid missing flux from longer-wavelength WISE bands. The subsequent segmentation required a minimum source size specified by the number of connected pixels, which we set to 10, with values above a threshold. This threshold was computed using Background 2D from PHOTUTILS and SIGMA_CLIPPED_STATS with a 3σ cut-off (this resulted in the best deblending). This cut-off, in turn, had been carefully estimated from the noise in the smoothed image. If required, overlapping sources were separated using PHOTUTILS’ DEBLEND_SOURCES function that combines multi-thresholding and watershed segmentation.
Subsequently, the photometry was performed using the PHOTUTILS function APERTURE_PHOTOMETRY. We used circular apertures centred at the galaxy’s centre, except for NGC 3263, for which we used an elliptical aperture that was properly adjusted to the galaxy’s shape. The axes were selected to be big enough to contain the entire source, primarily covering the same size observed in the radio images. We were unable to perform the photometry for the background galaxy PGC 087403, especially in the W3 band, because we could not resolve the galaxy from a source close to it. In Fig. 2, we show as an example the procedure applied for the galaxy NGC 3263. The four panels display the W3 band image, the 2D background estimation, the galaxy only, and the photometry. The results for the entire sample of galaxies are shown in Appendix D.
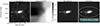 |
Fig. 2. Example of source identification and photometry with PHOTUTILS on the WISE W3 image of NGC 3263. From left to right: Original W3 image, background model, background-subtracted galaxy image, and final photometry. The white ellipse indicates the aperture used to measure the total flux density. The green circle corresponds to the 22″ isophote employed for comparison with catalogue values (see text). |
The photometric units were converted using the functions provided by PHOTUTILS. Uncertainties in the flux density were measured using APERTURESTATS and added in quadrature to the flux calibration errors of 2.4%, 2.8%, and 4.5% in W1, W2, and W3, respectively (Wright et al. 2010). The infrared fluxes are listed in Table 2. To check the photometry procedure, we also measured the fluxes within the 22″ isophote and compared these values with the catalogued values. We found that for W1, W2, and W3, all but one (NGC 3261) agree within 10% of the fluxes. The NGC 3261 flux in the W3 band is offset by 12%.
Integrated WISE infrared flux densities.
3.3. WISE colour-colour diagram
The WISE colour-colour diagram presented in Wright et al. (2010) has been explored as a diagnostic tool for large samples of galaxies (e.g. Cluver et al. 2017), large-sized galaxies (Jarrett et al. 2019), and pairs of galaxies (Bok et al. 2020). The W2 − W3 axis is commonly used to indicate the dust content and so roughly follows the galaxy type. For example, low-star-forming, dust-free early-type galaxies have bluer IR colours and are expected to lie in the bottom left of the colour-colour diagram (W2 − W3 < 2), while dusty, star-formation-dominated disc galaxies have redder IR colours (W2 − W3 > 3.5) and occupy the right side of the diagram. The intermediate disc spiral galaxies are between these extremes (2.0 < W2 − W3 < 3.5). The W1 − W2 colour traces the amount of hot dust. Above W1 − W2 = 0.8 are expected to lie the AGNs, assuming that the mid-infrared emission primarily comes from the dust heated by AGNs. The WISE colour-colour diagram of our galaxy sample is shown in Fig. 3. In the same plot, we depict the ‘star formation sequence’ curve fit by Jarrett et al. (2019) to 100 large galaxies. Departures from this sequence may reveal nuclear, starburst, and interacting and/or merging events. Thus, the WISE colour-colour diagram suggests that most of the galaxies in our sample are unlikely to harbour a powerful AGN. The highest W1 − W2 value in our sample is associated with NGC 3256, for which there is evidence of an obscured, low-luminosity AGN (Ohyama et al. 2015).
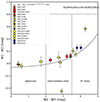 |
Fig. 3. WISE colour-colour diagram following Cluver et al. (2017). Early-type galaxies with low SFRs are located at the bottom left (W2 − W3 < 2), and star-forming discs are expected to be on the right side (W2 − W3 > 3.5). Intermediate discs are likely to be found between these regions. Above W1 − W2 = 0.8, heating from dusty AGNs primarily influences the mid-infrared emission. Error bars are displayed for each object unless smaller than the symbol. The black line traces the star formation sequence defined by Jarrett et al. (2019). The galaxy represented with a black dot is not detected in our radio continuum images. |
3.4. Infrared-radio correlation
The infrared radio correlation is one of the most intriguing relations in astronomy. It has been widely studied by many authors, empirically in the local Universe (Helou et al. 1985; Condon 1992; Yun et al. 2001; Bell et al. 2003), at different redshifts (Seymour et al. 2009; Basu et al. 2015; Delhaize et al. 2017; Yoon 2024; Molnár et al. 2021), and from a detailed analysis of certain galaxies (e.g. NGC 6946, Tabatabaei et al. 2013) to a statistical analysis of many local galaxies (Shao et al. 2018; Grundy et al. 2023).
Our work studies the infrared-radio relation, focused on the infrared WISE W3 band. It is an excellent tracer of ISM emissions, with contributions from polycyclic aromatic hydrocarbons (PAHs) in the photodissociation regions. However, the WISE W3 band is contaminated by evolved stellar populations. Thus, Cluver et al. (2017) proposed a method to remove this component from the evolved stars using the W1 band emission. The method consists of subtracting 15.8% of the W1 band flux from the W3 band flux for both the global and pixel-mapped flux densities. We denote these modified W3 band flux densities and any other measurements derived from them using the W3PAH subscript. Two galaxies have been excluded from the calculations: NGC 2434 due to its negative FW3PAH value, which suggests that the emission is dominated by the evolved stellar population with no significant PAH contribution, and NGC 3262 because it was not detected in our radio continuum images. The W3PAH flux for each galaxy is listed in Table 1. In Fig. 4, it is shown that the W3PAH flux density correlates with a 1.4 GHz radio continuum flux density. Therefore, we inferred the best-fit model:
 (1)
(1)
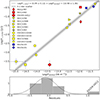 |
Fig. 4. Infrared-radio correlation using only the PAH component and radio continuum fluxes. Top panel: log(FW3PAH) vs log(F1.3 GHz) for galaxies with enough data (see text), following the legend. Error bars are shown unless smaller than the symbol. A linear fit, log(y) = m ⋅ log(x)+b, is plotted as a black line, with a shaded region indicating a 0.1 dex scatter. Bottom panel: Histogram of the squared differences between observed and fitted values. |
We used the least squares method, which minimises the squared orthogonal distances to the modelled relation. We measured the dispersion as the standard deviation of the data’s orthogonal offset distribution relative to the best-fit model. We found m = 0.99 ± 0.11 and b = 10.9 ± 1.4, and the dispersion is σ = 0.3. The histogram shows the squares of the differences between the observed and fitted values. The galaxy ESO 059-G012 lies outside the three-sigma range (Fig. 4). To measure the W3PAH-radio relation, we computed the more commonly used parameter defined as
 (2)
(2)
where F1.3 GHz is the radio continuum flux and Fλ depends the infrared data; see Yun et al. (2001) for further details. We find a mean value of qW3PAH = 2.5 ± 0.1. Fig. D.2 shows this qW3PAH value as a function of the equivalent W3PAH and radio continuum luminosity. The galaxy ESO 059-G012 has a three times larger infrared flux density than expected using the empirical relation of Yun et al. (2001). In Section 4, we discuss the physical properties inferred from these results.
We estimated the total infrared (TIR) luminosity by implementing the relationship between W3PAH and TIR found in Cluver et al. (2017):
 (3)
(3)
where νLW3PAH is the monochromatic W3PAH luminosity. The infrared-radio relation remains linear. The fitted values are mTIR = 1.1 ± 0.12 and bTIR = 9.27 ± 1.24 and the dispersion is σTIR = 0.5. The qTIR values are slightly lower than the qW3PAH values. We find a mean value of qTIR = 2.1 ± 0.5. Fig. D.2 shows the qTIR value as a function of TIR luminosity.
3.5. SED fitting
We performed a photometric analysis in order to construct spectral energy distributions (SEDs) for a subset of the galaxies in our sample. Using the photutils package, we re-measured fluxes in all four WISE bands and the radio continuum image. The Kron isophote was determined in the WISE W1 band and applied consistently across the other WISE bands and the radio image to ensure matched apertures. We were able to obtain reliable WISE photometry in all four bands only for the following galaxies: ESO59-G012, NGC 2434, NGC 3256, NGC 3256B, NGC 3256C, NGC 3263, NGC 6215, and NGC 6221. We performed the SED fitting using WISE and radio continuum data only. For NGC 2434, we used catalogued photometric data2.
This modelling was conducted using GalaPy (Ronconi et al. 2024), an open-source software package implemented in Python/C++ capable of modelling emission from the X-ray to the radio regimes. The underlying stellar populations were assumed to follow a Chabrier initial mass function (IMF; Chabrier 2003), within a ΛCDM cosmological framework (Planck Collaboration VI 2020). The main results are listed in Table E.2, along with a refined SFR estimation, the stellar age, and stellar mass. A complete description of the process is presented in Appendix E.
To place our galaxies in the context of the star-forming main sequence, we compared their stellar masses and SFRs with the parametrisations of Speagle et al. (2014) and Leslie et al. (2020), as is shown in Fig. 5. The former provides a redshift-dependent relation widely used across cosmic time, while the latter offers an updated characterisation based on a consistent analysis of nearby galaxies using multiple SFR tracers.
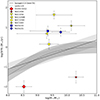 |
Fig. 5. Star formation rate as a function of stellar mass, both quantities derived from the SED fitting analysis. The dashed line shows the main-sequence relation from Leslie et al. (2020) and the solid black line the best-fit relation from Speagle et al. (2014). The shaded region indicates the 0.3 dex scatter Leslie et al. (2020), Speagle et al. (2014). |
3.6. Star-formation properties
We estimated the SFR of the galaxies using the 20 cm radio continuum flux density and the W3PAH monochromatic luminosity. The SFR based on the 20 cm radio continuum data was estimated using the formula by Condon et al. (2002). The recent high-mass SFR (> 5 M⊙) is given by
 (4)
(4)
where D is the distance in Mpc and S20 the 20 cm radio continuum flux density in Jansky. To estimate the SFR of all stars (> 0.1 M⊙), we multiplied the previous expression by 4.76; see Condon et al. (2002). The estimation of the SFR using W3PAH contribution was calculated using the following formula:
 (5)
(5)
Here, ν is the WISE W3 band central frequency (2.498 × 10¹³ Hz) and L⊙ = 3.828 × 1026 W (see Cluver et al. 2014). Because the IMFs adopted in Cluver et al. (2014) and Condon et al. (2002) differ, Kroupa IMF (Kroupa 2002) in the former and Salpeter IMF (Salpeter 1955) in the latter, we applied a correction to ensure consistency. Specifically, for SFRs derived assuming a Kroupa IMF and for the ones corresponding to a Salpeter IMF, we divided by a factor of 0.67 (Madau & Dickinson 2014). The results are listed in Table 3. Despite the evolutionary stage of the host group, most of the galaxies in our sample show a linear trend between their SFRs as determined by their W3PAH and radio continuum flux density; see Fig. D.3. In particular, the linear relation is close to 1:1 if considering the recent high-mass SFR above 5 M⊙, and only one galaxy lies outside the 10% scatter: ESO 059-G012. In contrast, when considering the SFR of stars with solar masses above 0.1, two galaxies are located outside the 10% scatter of the 1:1 linear relation. These galaxies are ESO 263-G033 and ESO 263-G044.
Derived SFR properties.
3.7. Radio spectral index
A galaxy’s spectral index (α) provides an insight into the different processes occurring within the galaxy. The spectral index is defined by the integrated flux density, S, at frequency ν; here, we used the convention Sν ∝ να. We measured the spectral indices by applying the in-band method. This method takes advantage of a single observation with a wide bandwidth. Our MeerKAT observations have a bandwidth of 856 MHz. However, to improve the rms of the continuum images to calculate the spectral index map, we combined channels 4 with 5 and channels 8 with 9. Thus, the in-band spectral index was calculated over a frequency range of 324 MHz, from 1021 MHz to 1345 MHz. The final rms in each image is 6.5 μJy and 2.1 μJy. We applied the primary beam correction before the calculation. Despite the effort to improve the signal-to-noise ratio, we can only obtain confident global spectral index values for the strongest radio-emitting galaxies within the primary beam corrected spatial region of each image; see Table 1. According to observations (Lisenfeld & Völk 2000), thermal emission has an optically thin spectral index of α ≥ −0.1, while non-thermal emission can have a spectral index that ranges between approximately −0.5 to −1.1, where a value of −0.5 corresponds to the non-thermal emission originating in star-forming regions where the thermal fraction is high.
We created the resolved spectral index map by using the spectral index definition for each pixel with a sigma-to-noise ratio above 5σ. To prevent bias in α, we compared the flux cuts, which were chosen based on sensitivity limits and frequencies. In Fig. 6, we show the spectral index and error maps for the galaxies NGC 3263, NGC 3256C, NGC 3256B, NGC 3256, NGC 6221, and NGC 6215. The galaxy NGC 2442 is close to the edge of the region affected by the primary beam correction, resulting in high error maps. The dark plum colour (more positive than α = −0.1) in our maps pinpoints the regions of flat spectral index associated with thermal emission. However, positive values can also be associated with errors in the map. The orange (more negative than α = −0.8) through yellow colours mark steep spectral values associated with non-thermal emission (English et al. 2024).
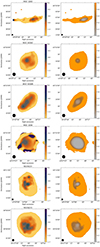 |
Fig. 6. Resolved spectral index and error maps of the brightest galaxies in our sample. The dark plum colour pinpoints the flat spectral index associated with thermal emission, while orange marks steep spectral values associated with non-thermal emission (English et al. 2024). |
Our spectral index maps show some structure in the spectral index distribution within the galaxies despite being created using the in-band spectral method. Some galaxies have regions with in-band spectral indices that are more positive than −0.2. However, these pixels occur in spatial areas of high error and may be associated with signal-to-noise artefacts – an example is NGC 3256. Within the spatial regions associated with low uncertainty, the flattest value observed is around −0.6, and generally these pixels occur in areas with strong radio continuum emission near the nuclei of the galaxies. The exception is NGC 3256C, in which the spectral index value of ≈ − 0.6 is located in the disc plane but offset from the galaxy’s centre. The steepest values observed in all galaxies are around −1.7, and these pixels occur towards the peripheral regions of the disc.
In Fig. D.4, we compare the spectral index value (see Table 1) of the galaxies with the obtained qW3PAH parameter. All the galaxies in the plot show a radio spectral index steeper than typical α = −0.8. Also, qW3PAH values are higher than q = 2.34 found by Yun et al. (2001), except for the galaxy NGC 3263 (qW3PAH = 2.3). Bressan et al. (2002) revisits the nature of the far infrared-radio correlation and explores a possible relation between spectral index and q parameter in the context of evolutionary models for starburst galaxies, predicting that galaxies follow specific tracks as they age. They noted that more evolved systems, located towards lower q and steeper spectral index, tend to have higher stellar masses. Additionally, Thomson et al. (2014) found observational evidence supporting this framework in a sample of high-redshift galaxies, and highlighted that galaxies with steep radio spectra are often associated with merger or interaction processes.
3.8. qW3PAH maps
The qW3PAH maps show the ratio of W3PAH to radio emission across different regions of a galaxy, as is indicated in Fig. 7. Physically, a high value of qW3PAH indicates strong star formation, where dust heated by young stars dominates the infrared emission and a low value may point to non-thermal processes such as synchrotron emission an AGN, where radio emission is stronger. The qW3PAH maps were created using Eq. (2) on a per-pixel basis. Each pixel at MeerKAT and W3PAH images requires emission above three sigma detections.
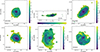 |
Fig. 7. NGC 3263, NGC 3256C, NGC 3256B, NGC 3256, NGC 6221, and NGC 6215 qW3PAH maps. The colour bar shows the qW3PAH range values. Black contours correspond to errors of 0.005, 0.01, 0.02, and 0.05 in parameter determination. High values of qW3PAH indicate radio-deficiency, while low values indicate radio-excess. |
The galaxies have qW3PAH maps with a lower median than their global qW3PAH values. The discrepancy between the global and resolved qW3PAH values likely arises from the spatial scale at which each measurement was performed. The galaxies NGC 3263, NGC 3256C, NGC 3256B, and NGC 6215 exhibit in their maps values of qW3PAH between 1.0 and 3.0, while NGC 3256 and NGC 6221 near the centre of the galaxies show qW3PAH values of less than 0.5.
3.9. Degree of interaction
Haan et al. (2011) proposed a merger stage classification based on I-band images. The numerical classification is defined in the following way: 0 = a non-merger, 1 = separate galaxies but symmetric (intact) discs, no tidal tails, and a maximum line-of-sight velocity difference range from 65 to 160 km s−1, 2 = progenitor galaxies distinguishable by asymmetric discs or amorphous and/or tidal tails, 3 = two nuclei in a common envelope, 4 = double nuclei plus a tidal tail, 5 = a single or obscured nucleus with long prominent tails, 6 = a single or obscured nucleus with a disturbed central morphology and short faint tails. Therefore, we classified the individual merger stages of the galaxies by an integer value ranging from 0 to 6, based on the work of Haan et al. (2011), but adding a sub-classification in stage 2. We separated it into two groups: the galaxies that show asymmetric discs and the galaxies with tails. The classification is written in Table 1. Most galaxies in our sample can be classified as stage two, except for NGC 3256 (stage 3), NGC 2434, ESO 059-G033, and ESO 059-G012 (stage 0). In Fig. D.5, we compare the merger stage classification with qW3PAH value. The galaxy ESO 059-G012 has an excess in the W3PAH emission and is classified as stage 0. All galaxies in merger stages 2, 2.5, and 3 display qW3PAH values within the excess lines.
4. Discussion
4.1. Global properties
The upper limit end of the radio luminosity distribution of the galaxy sample is < 1023 W Hz−1. This is consistent with that of the field galaxies, other groups such as Hickson compact groups (Menon 1995; Omar & Dwarakanath 2005), and late-type galaxies in nearby clusters (Reddy & Yun 2004). The W3PAH luminosity range also agrees with what is observed in other groups of galaxies, such as Eridanus (Grundy et al. 2023).
The WISE colour-colour diagram in Fig. 3 shows that galaxies are distributed differently in the diagram based on their evolutionary group stage. The galaxies representing an intermediate evolutionary group stage (yellow) span the length of the diagram, from ellipticals to spirals, normal and star-forming. One (NGC 3256) even resides close to the AGN region of the diagram. The most evolved group (red) presents galaxies in the elliptical and spiral regimes, and the early-stage group (blue) presents galaxies in the star-forming region. This result agrees with the group evolution theory.
It is shown in Fig. 5 that galaxies with clear signs of interaction lie above the main sequence defined by Leslie et al. (2020) and Speagle et al. (2014). However, it is important to note that the low dust content derived from the SED fitting of the galaxies NGC 2434 and ESO59-G012 might result from limitations in the model due to the lack of infrared data. A more complete infrared coverage is needed to assess whether these sources are truly quenched or if their SEDs are simply not well constrained. The low number of photometric measurements also impedes constraining the impact of AGN activity on the FIR-radio correlation. Therefore, we can only estimate a low AGN contribution based on WISE colour diagnostics, and this should be interpreted with caution.
The majority of the galaxies in our sample follow the radio-W3PAH correlation. Also, the SFR estimated using radio and W3PAH methods agrees, especially considering the star formation of massive stars. Leroy et al. (2021) report that W3 emission is tightly correlated with CO(2−1) emission, with a scatter of < 0.1 dex. Since CO traces molecular gas, our result supports the use of W3PAH as a proxy for H2 mass and suggests that the radio continuum emission scales nearly linearly with the molecular gas reservoir traced by PAH. Galaxies that deviate from the mean relation may therefore reflect variations in the relative abundance of molecular gas or differences in the dominant radio emission mechanisms.
The only galaxy that deviates beyond 3σ from the radio-W3PAH relation is ESO 059-G012 (Fig. 4). The galaxy is radio-deficient with a qW3PAH value of 3.7. This is not common. Yun et al. (2001) found only 9 galaxies in a sample of 1800 galaxies with q values greater than 3.0. ESO 059-G012 is classified as Sa and is the faintest galaxy detected in our radio continuum images. It is located in the north-east, away from the H I intergalactic gas cloud. We propose that the galaxy has already consumed the gas, and the infrared excess relative to the radio continuum emission is due to the heating of dust from the old stellar population. Moreover, no IR bump is seen in its SED shape (Fig. E.1).
We find a mean value of qW3PAH = 2.5 ± 0.1. Even though it is offset from the empirical relation (q = 2.34, Yun et al. 2001), within the errors, it agrees with the results presented in Shao et al. (2018), considering the entire sample, and in Grundy et al. (2023), calculated at the same frequency. In our galaxy sample, the qW3PAH parameter remains independent of the radio continuum and W3PAH luminosities. We do not observe a break at low W3PAH luminosities or a decrease in qW3PAH values in terms of an increment in stellar mass. Within the uncertainties, the range of in-band spectral indices for our galaxy sample is consistent with the ones of the 35 edge-on galaxies in the CHANG-ES3 survey (Schmidt et al. 2019). In our maps of the edge-on galaxies NGC 3263 and NGC 3256B, the spectral index steepens as height away from the mid-plane increases. The trend remains, although the error in our maps also increases. This is also consistent with findings noticed in CHANG-ES in-band observed spectral index maps and confirmed in analyses of non-thermal spectral index maps (e.g. Schmidt et al. 2019) and band-to-band non-thermal spectral index maps (e.g. Stein et al. 2023, and references therein). This steepening would be expected from cosmic ray ageing due to synchrotron electron energy loss (Irwin et al. 2024).
Galaxies NGC 6215, NGC 6221, NGC 3263, and NGC 3256C have in-band global spectral index values, listed in Table 1, associated with synchrotron radiation. However, they are steeper than the canonical value of −0.8 for non-AGN galaxies by Condon (1992) and more recent work such as An et al. (2021), who included MeerKAT data for band-to-band spectral index calculations. However, for their sample of SFGs, An et al. (2021) found a scatter in the distribution of  of 0.35 and their Fig. 2 shows a range as negative as −1.8. Thus, within our uncertainties, all our in-band determinations, shown in Fig. D.4, result in global spectral indices that are consistent with previous results.
We note that the non-thermal emission is generally attributed to cosmic rays from star formation. However, a contribution to the scatter and our global spectral index values for NGC 6215, NGC 6221, NGC 3263, and NGC 3256C may also arise from the interaction state of these galaxies. NGC 6215 and NGC 6221 are an interacting pair connected by an H I gas bridge (Koribalski 2004; Koribalski & Dickey 2004). The position of the galaxies in Fig. D.4, a steep α value and a low qW3PAH value, suggests that NGC 6215 lies in regions associated with aged starbursts (Bressan et al. 2002). NGC 6221 is complex, because its global spectral index is steep, indicating ageing cosmic rays, but with a high fraction of dust and an intense star formation activity.
NGC 3263 is an edge-on galaxy with a tidal tail that extends to the east of it; English et al. (2010) proposed that this galaxy interacts with NGC 3256C, along with NGC 3256B. The tidal shocks accompanying these interactions can increase the population of cosmic rays, and thus enhance the non-thermal radio emission (Prodanović et al. 2013). The values of the spectral index and qW3PAH parameter (see Fig. D.4) suggest that NGC 3256B and NGC 3256 galaxies may be undergoing active or early-stage star formation episodes, possibly in NGC 3256B, triggered by group-scale interactions, while NGC 3263 galaxy lies in regions associated with aged starbursts (Bressan et al. 2002).
Donevski & Prodanović (2015) found that most of the galaxies in their sample classified as merger stage 3 have q values between 1.8 and 2.6 with α values steeper than −0.6. We find a similar trend. The galaxies in that regime are those with clear signs of interaction, classified by us as merger stages 2, 2.5, and 3. Fig. D.5 shows that galaxies with known H I bridges or tails sub-classified by us as merger stage 2.5 show qW3PAH values close to 2.3, whereas the galaxies classified as stage 2.0 display a wide range of qW3PAH values.
4.2. Resolved properties of the brightest galaxies in the sample
In this section, we examine the resolved radio continuum and W3PAH properties of the brightest galaxies in our sample. Four are members of the NGC 3256/3263 group, and the other two are the ones in the NGC 6221 pair of galaxies. These groups are in intermediate and initial evolutionary stages, respectively.
The radio continuum distribution along these galaxies is similar to what is observed in W3PAH and optical images. Radio continuum and W3PAH trace the inner structures of these galaxies well. The derived resolved spectral index map shows some structure in the spectral index distribution within the galaxies despite being created using the in-band spectral method; see Fig. 6. Moreover, the qW3PAH maps reveal the presence of low-luminosity AGNs due to the radio excess detection in the cores of NGC 6221 and NGC 3256. In the following subsections, we discuss these galaxies individually.
4.2.1. NGC 3256
This galaxy is a merging system; two extended tidal tails are observed optically and in H I revealed by English et al. (2003). Because two different nuclei are present (Norris & Forbes 1995), we give the merger stage classification 3. Despite being very luminous in the far-infrared regime, it is not a far-infrared ultra-luminous source. Its starburst nature is supported by multi-wavelength evidence: ultraviolet data reveal the presence of hot, young stars (Kinney et al. 1993); radio continuum emission traces cosmic-ray electrons accelerated by supernovae, whose progenitors were massive stars (Norris & Forbes 1995); and infrared observations show OB stars ionising surrounding H II regions (Graham et al. 1984). Therefore, the galaxy’s position in the WISE colour-colour diagram is expected to be on the right side, with a value of W2 − W3 larger than 3.5, which is what we find. Moreover, the value of W1 − W2 for this galaxy approaches the limit of AGN classification; see Fig. 3. Because of the presence of massive, hot young stars and cosmic-ray electrons, the global spectral index is expected to be dominated by non-thermal emission. We find a global  , confirming that. However, the spectral index map also reveals a region with values around −0.6 ± 0.1, suggesting a star-forming region.
We cannot distinguish either nucleus in our radio continuum map; see Fig. 1. The SFRs of this galaxy are the highest in our galaxy sample, SFR20 cm [> 0.1 M⊙ yr−1] = 98.15 and SFRW3PAH [M⊙ yr−1] = 34.
The qW3PAH global value is 2.3; however, the qW3PAH map reaches values lower than 1.5, which are predominant in regions where the star formation process occurs. Besides, there is a clear radio excess where the nuclei are, which points to the existence of AGN activity, in agreement with Ohyama et al. (2015). Those authors found evidence of a heavily absorbed low-luminosity AGN in the NGC 3256 southern nucleus. Furthermore, recent JWST observations by Bohn et al. (2024) have revealed a prominent, collimated warm molecular outflow originating exclusively from the southern nucleus, extending up to ∼0.7 kpc, with intrinsic velocities reaching ∼1000 km s−1. This outflow is spatially and kinematically aligned with previously known cold molecular and atomic outflows (e.g. Cazzoli et al. 2016), and is interpreted as being driven by the southern nucleus. In contrast, no warm molecular outflow is detected around the northern nucleus, suggesting significant differences in feedback processes between the two. These results reinforce the scenario in which the southern nucleus hosts a low-luminosity AGN, while the northern nucleus is dominated by starburst activity.
4.2.2. NGC 3256B
This galaxy is classified as SB(s)bc galaxy. Its inclination is ∼73° based on the axis ratio (b/a) estimated by Lauberts & Valentijn (1989). Because the brightness on one side of the galaxy is slightly fainter than the other, we give the merger stage classification 2. Its W3PAH luminosity is ∼109.5 L⊙.
The SFR of this galaxy is SFR20 cm [> 0.1 M⊙ yr−1] = 7.62 and SFRW3PAH [M⊙ yr−1] = 1.4. These values agree with the ones expected for classical spiral galaxies. The WISE colour-colour diagram shows that this galaxy is located in the star-forming region and somewhat above the star formation sequence track. We note that its modest SFRW3PAH value is included in the range of SFRs associated with the star-forming category defined for this diagram in Jarrett et al. (2019). With respect to the higher W1 − W2 colour, there are sources of heating other than intense star formation that could contribute to enhancing the temperature of the dust. For example, for interacting galaxies, their dust can be heated by tidal shocks (Donevski & Prodanović 2015) and by the radiation field of a larger companion galaxy (Nersesian et al. 2020).
Its global spectral index is −0.8 ± 0.2, typical for normal SFGs. The spectral index map shows that the index is around −0.6 within the galaxy disc. In particular, it is observed that in the same disc it reaches flatter values in the south-eastern region, while in the north-west direction, where the spiral arm seems to be more open, it has steeper values.
Although the qW3PAH global value is 2.3, the qW3PAH map shows that values around 1.5 are predominant in the central region of the galaxy and within the spiral arms, especially in the same region where the spectral index has the more flattened value. As can be observed from the qW3PAH map, Fig. 7, the qW3PAH values span from 1.0 to 3.0. This observation suggests that star formation is probably occurring in the south-eastern region.
4.2.3. NGC 3256C
This galaxy is classified as SB(rs)d. Its inclination is ∼42° based on the axis ratio (b/a) estimated by Lauberts & Valentijn (1989). English et al. (2010) proposed that the galaxy-galaxy interaction among NGC 3256C, NGC 3256B, and NGC 3256 is the main process that produced the Vela Cloud complex. Because the brightness distribution of NGC 3256C is not symmetric, we give the merger stage classification 2. The arms towards the south-west side of the galaxy seem to be more open. Moreover, optical images show clumpy regions in the south-west. Its W3PAH luminosity is ∼109 L⊙.
The SFR estimated using radio and W3PAH agrees, especially considering the star formation of massive stars. The SFRs of this galaxy are low, SFR20cm [> 0.1 M⊙ yr−1] = 4.74 and SFRW3PAH [M⊙ yr−1] = 1.1. The WISE colour-colour diagram shows that it is located in the star-forming region, which is unexpected if this region were to indicate enhanced star-forming activity. However, a few galaxies in Jarrett et al. (2019) also have this value or even lower yet reside in this region of the diagram.
Its global spectral index is −1.5 ± 0.4. The spectral index map shows that the index is around −0.6 in the region where dust and stars are more concentrated. Although the qW3PAH global value is 2.3, the qW3PAH map shows that values around 1.25 are predominant in the central region of the galaxy and within the spiral arms. As can be observed from the qW3PAH map in Fig. 7, the qW3PAH values span from 1.0 to 3.0.
4.2.4. NGC 3263
This galaxy is classified as SB(rs)cd. It is an almost edge-on galaxy with a tail that extends to the east of it. English et al. (2010) found a possible H I bridge, 67 kpc long, connecting NGC 3263 with ESO 263-G044. NGC 3263’s arm extends in the opposite direction to the Vela Cloud, confirming that the Vela Cloud is superfluous for producing the tidal features of NGC 3263. Because of these signs of galaxy-galaxy interaction, we give the merger stage classification number 2.5. Its W3PAH luminosity is ∼1010 L⊙. In the WISE colour-colour diagram, it is located close to the limit of being classified as a SFG. Its global spectral index is −1.2 ± 0.1. The spectral index map shows that the index is around −0.6 in the core region. The SFRs of this galaxy are high, SFR20 cm [> 0.1 M⊙ yr−1] = 30.5 and SFRW3PAH [M⊙ yr−1] = 5.3. Although the global qW3PAH, value is 2.3, as is shown in the qW3PAH map (Fig. 7), the values span from 0.5 to 3.0. The map reveals slightly lower values within the stellar disc, possibly due to enhanced radio emission linked to environmental interaction. Interestingly, at the tip of the tail, there is a clear radio deficiency relative to the W3PAH emission. This region also shows a flatter spectral index of around −0.2, suggesting a larger thermal contribution. Although the uncertainties in this area are relatively high, both the spectral and qW3PAH maps point towards the possibility of triggered star formation in this part of the galaxy. Further insights could be gained from higher-resolution data and a multi-wavelength analysis.
4.2.5. NGC 6221
The galaxy NGC 6221 is classified as a barred spiral of type SB(s)c. It has an optical diameter of 3.5′×2.5′ (inclination ∼43°), with a large amount of dust visible in both spiral arms as well as along the bar. The northern arm sharply turns (> 90°) and continues for another 2′ towards the south-east. A clumpy radio continuum region (north of the nucleus) agrees with a blue H II region complex, suggesting recent star formation, possibly induced by the interaction. We give the merger stage classification 2.5. Its W3PAH luminosity is ∼1010 L⊙. The WISE colour-colour diagram shows that it is located in the star-forming region. Its global spectral index is −1.4 ± 0.1. The spectral index map shows that the index is around −0.6 in the core region, in the hammer-like structure, and a clump at α, δ(J2000) = 16h 52m 45s, −59° 12′ 00″.
The SFRs of this galaxy are high: SFR20 cm [> 0.1 M⊙ yr−1] = 16.3 and SFRW3PAH [M⊙ yr−1] = 5.1. Although the global value of qW3PAH is 2.2, the qW3PAH map shows low values, such as 0.6 in the galaxy core. This is a clear radio excess where the nuclei are, which points to the existence of AGN activity. Besides, NGC 6221 has been shown to host significant molecular outflows, as was reported by Stone et al. (2016). The same authors identified NGC 6221 as a type II AGN (dusty, obscured torus), which could affect the radio-to-IR connection in this system. The hammer-like structure and the clump region show values between 1.0 and 1.6, indicating a good correlation between W3PAH and radio continuum emission.
4.2.6. NGC 6215
This galaxy is classified as SA(s)c. Its inclination is ∼38°. The galaxy has a smaller optical diameter of 2.1′×1.8′. We give the merger stage classification 2.5. Its W3PAH luminosity is ∼109.5 L⊙. The WISE colour-colour diagram shows that it is located in the star-forming region. Its global spectral index is −1.2 ± 0.1. The spectral index map shows that the index is around −0.6 in the core region, where the galaxy structure seems compressed. The SFRs of this galaxy are high, SFR20 cm [> 0.1 M⊙ yr−1] = 13.5 and SFRW3PAH [M⊙ yr−1] = 2.1. The qW3PAH map does not show a considerable gradient. The lower value is in the core. But it does show that most of the star-forming activity occurs where the gas is more compressed due to the interaction with NGC 6221.
5. Summary
We obtained high-resolution radio continuum observations of three groups of galaxies at different evolutionary stages using the MeerKAT radio telescope with a mean angular resolution of 8″ × 6.7″ and ∼5.6 μJy beam−1 rms. The radio continuum emission was detected from the galaxy pair NGC 6215/6221 and three background field galaxies, ten galaxies in the NGC 3256/3263 group, and four galaxies in the NGC 2434 group as well as three background field galaxies.
We complemented our data with WISE infrared images and measured the integrated WISE W1, W2, and W3 band flux densities for our galaxy sample using PHOTUTILS (Bradley et al. 2016, 2020). This allowed us to construct a WISE colour-colour diagram, perform SED fitting, and estimate a relation between the SFR and the stellar mass. The galaxies lying in the star-forming main sequence are distributed appropriately for the evolutionary stage of their group. For example, the galaxies residing in the intermediate evolutionary group stage (NGC 3256/3263) span all three categories, from spheroidals through intermediate discs to star-forming discs. One galaxy, NGC 3256, resides in a part of the colour-colour diagram towards the AGN region. Galaxies in the most evolved galaxy group (NGC 2434) reside in the spheroidal and intermediate disc regimes, and the galaxy pair in the group in the earliest evolution stage (NGC 6221) are both located in the star-forming region.
We estimated the contribution from the PAH following the method of Cluver et al. (2017) and assessed the version of the infrared-radio correlation known as the W3PAH-radio relation. Most galaxies in our sample follow that relation, except for ESO 059-G012, which is a member of the most evolved group in the sample. The galaxy has already converted much of its gas into stars, and the infrared excess relative to the radio continuum emission is due to the heating of dust by the old stellar population.
For our sample, we found a qW3PAH mean value of 2.5 ± 0.1. Even though it is offset from the empirical relation (q = 2.3, Yun et al. 2001), within uncertainties, it agrees with the result presented in Shao et al. (2018), considering the entire sample, and Grundy et al. (2023), calculated at the same frequency for the galaxies in the Eridanus group. We observed that the qW3PAH parameter remains independent of the radio continuum and W3PAH luminosities.
The qW3PAH maps of two galaxies, NGC 3256 and NGC 6221, highlight the presence of low-luminosity AGNs. This agrees with what was proposed by Ohyama et al. (2015) and Koribalski & Dickey (2004) for each galaxy, respectively. Additionally, the qW3PAH maps of the galaxies with clear signs of interactions, such as tails or bridges, or classified as a merger, are the maps with a wide range of qW3PAH values. In particular, the galaxy NGC 6215 shows a gradient towards the bridge that connects this galaxy with NGC 6221.
Since star formation is one of the dominant physical processes in the formation and evolution of galaxies, we examined their SFR characteristics in groups at three different evolutionary stages. From this modest, preliminary investigation, we found that:
-
Representing an early stage of evolution, the galaxies in the NGC 6221 group are morphologically interacting rather than merging. We found, according to the radio continuum fluxes, that both galaxies have a high SFR of 13.5 and 16.3 M⊙ yr−1. Their spectral indices indicate that they are dominated by synchrotron emission, as was expected from work of Prodanović et al. (2013).
-
Representing the intermediate stage of group evolution is the NGC 3256/NGC 3263 Group. Previous work showed that morphologically the galaxies include minor interactions (e.g. NGC 3263) and a major merger (NGC 3256), along with disturbed dwarf galaxies. From the radio fluxes, four out of nine galaxies have a high SFR above 5 M⊙ yr−1, two have a modest SFR, and the remaining three have a low SFR below 0.3 M⊙ yr−1.
-
Representing a later evolutionary stage is the NGC 2434 Group, which has three disturbed spiral galaxies and one elliptical. The non-ellipticals have radio fluxes that indicate SFRs ranging from 13.4 to 0.008 M⊙ yr−1.
Data availability
The MeerKAT data used here are available through the SARAO Data Archive4. The radio continuum cutouts images of the galaxies are available at the CDS via https://cdsarc.cds.unistra.fr/viz-bin/cat/J/A+A/701/A87. Besides, all images used in this publication will be made available upon reasonable request to the lead author.
Acknowledgments
We are grateful to the anonymous referee for a critical reading of the manuscript and for very useful suggestions. We acknowledge the effort of Ian Heywood and Dane Kleiner in processing the data and thank Jing Yeung for his contribution. J.S. thanks Alberto Noriega-Crespo for helpful discussions on WISE image units, and Ivan Lopez and Rodrigo Haack for checking the photometry procedure. P.K.H. gratefully acknowledges the Fundação de Amparo à Pesquisa do Estado de São Paulo (FAPESP) for the support grant 2023/14272-4. This paper is based on observations obtained with the MeerKAT telescope, where the South African Radio Astronomy Observatory, a facility of the National Research Foundation, an agency of the Department of Science and Innovation, operates.
References
- An, F., Vaccari, M., Smail, I., et al. 2021, MNRAS, 507, 2643 [NASA ADS] [CrossRef] [Google Scholar]
- Basu, A., Wadadekar, Y., Beelen, A., et al. 2015, ApJ, 803, 51 [NASA ADS] [CrossRef] [Google Scholar]
- Bell, E. F., McIntosh, D. H., Katz, N., & Weinberg, M. D. 2003, ApJS, 149, 289 [Google Scholar]
- Bohn, T., Inami, H., Togi, A., et al. 2024, ApJ, 977, 36 [NASA ADS] [CrossRef] [Google Scholar]
- Bok, J., Skelton, R. E., Cluver, M. E., et al. 2020, MNRAS, 499, 3193 [NASA ADS] [CrossRef] [Google Scholar]
- Bradley, L., Sipocz, B., Robitaille, T., et al. 2016, Astrophysics Source Code Library [record ascl:1609.011] [Google Scholar]
- Bradley, L., Sipőcz, B., Robitaille, T., et al. 2020, https://doi.org/10.5281/zenodo.4049061 [Google Scholar]
- Bressan, A., Silva, L., & Granato, G. L. 2002, A&A, 392, 377 [NASA ADS] [CrossRef] [EDP Sciences] [Google Scholar]
- Cazzoli, S., Arribas, S., Maiolino, R., & Colina, L. 2016, A&A, 590, A125 [NASA ADS] [CrossRef] [EDP Sciences] [Google Scholar]
- Chabrier, G. 2003, PASP, 115, 763 [Google Scholar]
- Cluver, M. E., Jarrett, T. H., Hopkins, A. M., et al. 2014, ApJ, 782, 90 [Google Scholar]
- Cluver, M. E., Jarrett, T. H., Dale, D. A., et al. 2017, ApJ, 850, 68 [Google Scholar]
- Condon, J. J. 1992, ARA&A, 30, 575 [Google Scholar]
- Condon, J. J., Cotton, W. D., & Broderick, J. J. 2002, AJ, 124, 675 [Google Scholar]
- Davies, L. J. M., Huynh, M. T., Hopkins, A. M., et al. 2017, MNRAS, 466, 2312 [Google Scholar]
- Delhaize, J., Smolčić, V., Delvecchio, I., et al. 2017, A&A, 602, A4 [NASA ADS] [CrossRef] [EDP Sciences] [Google Scholar]
- Delvecchio, I., Daddi, E., Sargent, M. T., et al. 2021, A&A, 647, A123 [NASA ADS] [CrossRef] [EDP Sciences] [Google Scholar]
- Donevski, D., & Prodanović, T. 2015, MNRAS, 453, 638 [Google Scholar]
- English, J., Norris, R. P., Freeman, K. C., & Booth, R. S. 2003, AJ, 125, 1134 [Google Scholar]
- English, J., Koribalski, B., Bland-Hawthorn, J., Freeman, K. C., & McCain, C. F. 2010, AJ, 139, 102 [NASA ADS] [CrossRef] [Google Scholar]
- English, J., Richardson, M. L. A., Ferrand, G., & Deg, N. 2024, Astrophysics Source Code Library [record ascl:2401.005] [Google Scholar]
- Fouque, P., Gourgoulhon, E., Chamaraux, P., & Paturel, G. 1992, A&AS, 93, 211 [NASA ADS] [Google Scholar]
- Garcia, A. M. 1993, VizieR Online Data Catalog: J/A+AS/100/47 [Google Scholar]
- Graham, J. R., Wright, G. S., Meikle, W. P. S., Joseph, R. D., & Bode, M. F. 1984, Nature, 310, 213 [Google Scholar]
- Grundy, J. A., Wong, O. I., Lee-Waddell, K., et al. 2023, PASA, 40, e012 [Google Scholar]
- Haan, S., Surace, J. A., Armus, L., et al. 2011, AJ, 141, 100 [Google Scholar]
- Helou, G., Soifer, B. T., & Rowan-Robinson, M. 1985, ApJ, 298, L7 [Google Scholar]
- Humire, P. K., Dey, S., Ronconi, T., et al. 2025, A&A, 699, A183 [NASA ADS] [CrossRef] [EDP Sciences] [Google Scholar]
- Irwin, J., Beck, R., Cook, T., et al. 2024, Galaxies, 12, 22 [NASA ADS] [CrossRef] [Google Scholar]
- Jarrett, T. H., Cluver, M. E., Brown, M. J. I., et al. 2019, ApJS, 245, 25 [Google Scholar]
- Jonas, J. L. 2009, IEEE Proc., 97, 1522 [Google Scholar]
- Jonas, J., & MeerKAT Team 2016, MeerKAT Science: On the Pathway to the SKA, 1 [Google Scholar]
- Józsa, G. I. G., White, S. V., Thorat, K., et al. 2020a, ASP Conf. Ser., 527, 635 [Google Scholar]
- Józsa, G. I. G., White, S. V., Thorat, K., et al. 2020b, Astrophysics Source Code Library [record ascl:2006.014] [Google Scholar]
- Kinney, A. L., Bohlin, R. C., Calzetti, D., Panagia, N., & Wyse, R. F. G. 1993, ApJS, 86, 5 [CrossRef] [Google Scholar]
- Koribalski, B. 1996, ASP Conf. Ser., 106, 238 [Google Scholar]
- Koribalski, B. S. 2004, IAU Symp., 217, 34 [Google Scholar]
- Koribalski, B. S. 2020, The Realm of the Low-Surface-Brightness Universe, 355 [Google Scholar]
- Koribalski, B., & Dickey, J. M. 2004, MNRAS, 348, 1255 [Google Scholar]
- Koribalski, B. S., Staveley-Smith, L., Kilborn, V. A., et al. 2004, AJ, 128, 16 [Google Scholar]
- Koribalski, B. S., Veronica, A., Dolag, K., et al. 2024, MNRAS, 531, 3357 [CrossRef] [Google Scholar]
- Kourkchi, E., & Tully, R. B. 2017, ApJ, 843, 16 [NASA ADS] [CrossRef] [Google Scholar]
- Kroupa, P. 2002, Science, 295, 82 [Google Scholar]
- Lauberts, A., & Valentijn, E. A. 1989, The Surface Photometry Catalogue of the ESO-Uppsala Galaxies (Garching: European Southern Observatory) [Google Scholar]
- Laustsen, S., Madsen, C., & West, R. M. 1987, Exploring the Southern Sky. A Pictorial Atlas from the European Southern Observatory (ESO) (New York: Springer-Verlag) [Google Scholar]
- Leroy, A. K., Schinnerer, E., Hughes, A., et al. 2021, ApJS, 257, 43 [NASA ADS] [CrossRef] [Google Scholar]
- Leslie, S. K., Schinnerer, E., Liu, D., et al. 2020, ApJ, 899, 58 [Google Scholar]
- Lípari, S., Díaz, R., Taniguchi, Y., et al. 2000, AJ, 120, 645 [CrossRef] [Google Scholar]
- Lisenfeld, U., & Völk, H. J. 2000, A&A, 354, 423 [NASA ADS] [Google Scholar]
- Madau, P., & Dickinson, M. 2014, ARA&A, 52, 415 [Google Scholar]
- Mauch, T., Cotton, W. D., Condon, J. J., et al. 2020, ApJ, 888, 61 [Google Scholar]
- Menon, T. K. 1995, MNRAS, 274, 845 [NASA ADS] [Google Scholar]
- Molnár, D. C., Sargent, M. T., Leslie, S., et al. 2021, MNRAS, 504, 118 [CrossRef] [Google Scholar]
- Murphy, E. J. 2013, ApJ, 777, 58 [Google Scholar]
- Murphy, E. J., Kenney, J. D. P., Helou, G., Chung, A., & Howell, J. H. 2009, ApJ, 694, 1435 [CrossRef] [Google Scholar]
- Nersesian, A., Viaene, S., De Looze, I., et al. 2020, A&A, 643, A90 [NASA ADS] [CrossRef] [EDP Sciences] [Google Scholar]
- Norris, R. P., & Forbes, D. A. 1995, ApJ, 446, 594 [Google Scholar]
- Ohyama, Y., Terashima, Y., & Sakamoto, K. 2015, ApJ, 805, 162 [Google Scholar]
- Omar, A., & Dwarakanath, K. S. 2005, JApA, 26, 89 [NASA ADS] [Google Scholar]
- Pence, W. D., & Blackman, C. P. 1984, MNRAS, 207, 9 [CrossRef] [Google Scholar]
- Planck Collaboration VI. 2020, A&A, 641, A6 [NASA ADS] [CrossRef] [EDP Sciences] [Google Scholar]
- Prodanović, T., Bogdanović, T., & Urošević, D. 2013, Phys. Rev. D, 87, 103014 [Google Scholar]
- Reddy, N. A., & Yun, M. S. 2004, ApJ, 600, 695 [NASA ADS] [CrossRef] [Google Scholar]
- Ronconi, T., Lapi, A., Torsello, M., et al. 2024, A&A, 685, A161 [NASA ADS] [CrossRef] [EDP Sciences] [Google Scholar]
- Ryder, S. D., & Koribalski, B. S. 2004, IAU Symp., 217, 44 [Google Scholar]
- Ryder, S. D., Koribalski, B., Staveley-Smith, L., et al. 2001, ApJ, 555, 232 [Google Scholar]
- Salpeter, E. E. 1955, ApJ, 121, 161 [Google Scholar]
- Sandage, A., & Bedke, J. 1994, The Carnegie Atlas of Galaxies (Carnegie Institution of Washington Publ.) [Google Scholar]
- Schmidt, P., Krause, M., Heesen, V., et al. 2019, A&A, 632, A12 [NASA ADS] [EDP Sciences] [Google Scholar]
- Seymour, N., Huynh, M., Dwelly, T., et al. 2009, MNRAS, 398, 1573 [CrossRef] [Google Scholar]
- Shao, L., Koribalski, B. S., Wang, J., Ho, L. C., & Staveley-Smith, L. 2018, MNRAS, 479, 3509 [NASA ADS] [CrossRef] [Google Scholar]
- Speagle, J. S., Steinhardt, C. L., Capak, P. L., & Silverman, J. D. 2014, ApJS, 214, 15 [Google Scholar]
- Stein, M., Heesen, V., Dettmar, R. J., et al. 2023, A&A, 670, A158 [NASA ADS] [CrossRef] [EDP Sciences] [Google Scholar]
- Stone, M., Veilleux, S., Meléndez, M., et al. 2016, ApJ, 826, 111 [NASA ADS] [CrossRef] [Google Scholar]
- Tabatabaei, F. S., Schinnerer, E., Murphy, E. J., et al. 2013, A&A, 552, A19 [NASA ADS] [CrossRef] [EDP Sciences] [Google Scholar]
- Thomson, A. P., Ivison, R. J., Simpson, J. M., et al. 2014, MNRAS, 442, 577 [NASA ADS] [CrossRef] [Google Scholar]
- Vega Beltran, J. C., Zeilinger, W. W., Amico, P., et al. 1998, A&AS, 131, 105 [Google Scholar]
- Verdes-Montenegro, L., Yun, M. S., Williams, B. A., et al. 2001, A&A, 377, 812 [NASA ADS] [CrossRef] [EDP Sciences] [Google Scholar]
- Wright, E. L., Eisenhardt, P. R. M., Mainzer, A. K., et al. 2010, AJ, 140, 1868 [Google Scholar]
- Yoon, I. 2024, ApJ, 975, 15 [Google Scholar]
- Yun, M. S., Reddy, N. A., & Condon, J. J. 2001, ApJ, 554, 803 [Google Scholar]
Appendix A: Galaxy groups
A.1. The NGC 6221 galaxy group
The NGC 6221 galaxy group consists of about 5 galaxies. There are at least three dwarf galaxies (Koribalski & Dickey 2004) and another two form a spiral galaxy pair NGC 6221 (vhel = 1499 km s−1) and NGC 6215 (vhel = 1564 km s−1), where vhel is the galaxy’s velocity in the heliocentric frame. The pair separation is ∼100 kpc at the adopted group distance of D = 18 Mpc. Their relative proximity, the peculiar appearance of NGC 6221 at different wavelengths such as optical (Pence & Blackman 1984), Hα (Vega Beltran et al. 1998), and the presence of an extended H I bridge connecting the pair (Koribalski & Dickey 2004) indicate that these galaxies are interacting. In addition, NGC 6221 is likely interacting with its three low-surface brightness dwarf companions (Koribalski 1996).
NGC 6221 is a barred spiral galaxy. The bar identified in optical and infrared images (Laustsen et al. 1987; Sandage & Bedke 1994) lies at a position angle (PA) of 118° (Pence & Blackman 1984) and has a length of 5.2 kpc. From its ends, two spiral arms extend symmetrically. However, the northern arm has a peculiar extension, which is relatively faint in infrared images. NGC 6215 is generally classified as a non-barred spiral galaxy and has an optical diameter 40% smaller than NGC 6221.
A.2. The NGC 3256/3263 galaxy group
The NGC 3256/3263 galaxy group consists of three sub-groups centred on (from north to south) NGC 3256 (vhel = 2836 km s−1), NGC 3263 (vhel = 2935 km s−1) and NGC 3261 (vhel = 2512 km s−1). The NGC 3256 and NGC 3263 galaxy groups are difficult to distinguish from each other spatially and kinematically as their systemic velocities differ by less than 200 km s−1. Different authors have applied group-finding algorithms to determine the members of these groups (e.g., Fouque et al. 1992; Garcia 1993; Lípari et al. 2000). The latest publication of them (Kourkchi & Tully 2017) considers ten galaxies to be members of a single large group spanning a few degrees at a distance of 38 Mpc (∼1° = 600 kpc).
All members of the NGC 3256/3263 group show varying degrees of tidal interactions and complex kinematic behaviour (Lípari et al. 2000; English et al. 2010). In particular, the group contains the gas-rich merging galaxy NGC 3256, surrounded by numerous H I fragments. Additionally, there are distorted spiral galaxies, such as the edge-on galaxy NGC 3263 with a tidal tail, NGC 3256B and NGC 3256C, and the face-on galaxy NGC 3261 with three dwarf companions in its surroundings.
The most interesting feature within the group is the galaxy-sized H I complex (the “Vela Cloud”) that was discovered by English et al. (2010) using the Australia Telescope Compact Array (ATCA) and the 64-m Parkes telescope. The Vela Cloud is located just west of NGC 3263 and south of the merger NGC 3256, spans at least 9′×16′ (100 kpc × 175 kpc, at the adopted distance of 38 Mpc) and has an H I mass of 3 − 5 × 10⁹ M⊙ (English et al. 2010). In addition, a possible H I bridge between NGC 3263 and ESO 263-G044, 67 kpc long, appears to connect both galaxies (English et al. 2010). The H I column density of the bridge is 3 − 6 × 10¹⁹ atoms cm−2, which is similar to the Vela Cloud diffuse components.
A.3. The NGC 2434 galaxy group
The NGC 2434 group, named after the central gas-poor elliptical galaxy (vhel = 1367 km s−1), contains four large galaxies and several dwarf galaxies. The most prominent group member is the one-armed spiral NGC 2442 (vhel = 1466 km s−1), close to which Ryder et al. (2001) discovered a massive (∼109 M⊙) H I cloud catalogued as HIPASS J0731–69 (see also Koribalski et al. 2004). NGC 2434 and NGC 2442 are separated by only 17′ or 85 kpc, at the adopted distance of D = 17 Mpc. The H I cloud is located between NGC 2442 and the galaxy pair NGC 2397 (vhel = 1355 km s−1) and NGC 2397B (vhel = 1376 km s−1). Close inspection of the HIPASS data cube revealed H I emission along a partial ring, spanning about 40′×20′ (200 kpc × 100 kpc) connecting to the one-armed spiral NGC 2442 (Koribalski 2020). High-resolution ATCA H I data reveal numerous high-density H I clouds along the ring structure (Ryder & Koribalski 2004), but no stellar counterparts have yet been detected.
Appendix B: MeerKAT observing parameters
MeerKAT observing parameters.
Appendix C: MeerKAT radio continuum data
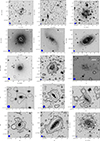 |
Fig. C.1. High-resolution MeerKAT 20-cm radio continuum of the galaxies overlaid onto DSS R-band optical images. First row: ESO 138-1, ESO 138-4, and ESO 138-5 (background galaxies, NGC 6221 group), the contour levels are 0.03, 0.2, 0.5, 1, 3 and 8 mJy beam−1. Second row: NGC 2434, ESO 59-G0012, and NGC 2397 (NGC 2442 group), the contour levels are 0.027, 0.09, and 0.27 mJy beam−1. From the third to the fifth rows: ESO263-33, NGC 3256C, NGC 3256A, LEDA 087403, ESO 263-44, ESO 263-46, ESO 263-45 (background galaxy), NGC 3256B and NGC 3261 (NGC 3256/3263 group). The contour levels are 0.027, 0.045, 0.18, 0.45, 0.9, 2.7, and 7.2 mJy beam−1. Contours are shown in black or white for display purposes. The synthesised beam is displayed at the bottom-left corner of each panel. |
Appendix D: WISE photometry
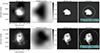 |
Fig. D.1. Source identification and photometry using PHOTUTILS over the WISE W3-band images. From left to right: original W3 image, background model, background-subtracted galaxy image, and final photometry. The white circle indicates the aperture used to measure the total flux density. The green circle corresponds to the 22″ isophote employed for comparison with catalogue values. |
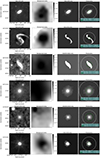 |
Fig. D.1. continued. |
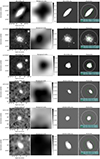 |
Fig. D.1. continued. |
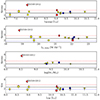 |
Fig. D.2. The qW3PAH value as a function of W3PAH, 1.3 GHz luminosity, stellar mass, and qTIR vs TIR luminosity. Error bars are displayed for each object unless smaller than the symbol. Except for the errors in the mass determination, which are not shown. The solid line is the same as in Yun et al. (2001)q = 2.34. The blue and red dotted lines show the value corresponding to three times larger radio and W3PAH flux density than expected. |
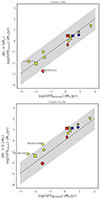 |
Fig. D.5. Comparison of galaxy SFRs based on 20-cm radio continuum and W3PAH flux densities. The top panel shows the SFR using Eq. 4, which accounts for stars with masses > 5 M⊙, while the bottom panel accounts for stars with masses > 0.1 M⊙. The linear function plotted represents the 1:1 relation; the shaded region indicates the 10% scatter. |
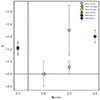 |
Fig. D.6. Comparison of the qW3PAH parameter with global spectral index. Error bars, in the spectral index determination, are displayed for each object. The dotted line at q = 2.34 corresponds to the value found by Yun et al. (2001), and the dotted line at α = −0.8 marks the classical value, which is adopted to show the predominance of non-thermal emission. |
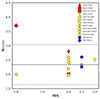 |
Fig. D.7. Comparison of qW3PAH parameters and merger stage. The dashed line is the same as in Yun et al. (2001, q = 2.34), and the dotted lines show the value corresponding to five times larger radio or FIR flux density than expected. |
Appendix E: SED fitting and data acquisition
We performed the SED fitting of galaxies within our sample for which sufficient photometric data were available in the WISE archive, obtained via the SkyView service5. This modelling was conducted using GalaPy (Ronconi et al. 2024), an open-source software package implemented in Python/C++ capable of modelling emission from the X-ray to the radio regimes. The underlying stellar populations were assumed to follow a Chabrier IMF (Chabrier 2003), within a ΛCDM cosmological framework (Planck Collaboration VI 2020). GalaPy offers a selection of distinct star formation history models. For the present study, we employed the In-Situ model, which has demonstrated efficacy in predicting the emission characteristics of galaxies across a range of types and redshift (Ronconi et al. 2024; Humire et al. 2025). This model facilitates a self-consistent tracking of the evolution of gas, dust, and metallicity in conjunction with star formation processes, thereby ensuring internal coherence among the derived physical parameters. In terms of dust treatment, GalaPy incorporates a two-component model that circumvents the assumption of a pre-defined attenuation curve, instead deriving it from structural parameters. These two components represent: (1) the molecular cloud (MC) phase, associated with young stellar populations, and (2) a diffuse dust (DD) medium that further attenuates the stellar emission. Therefore, the emission from both components is modelled via two independent modified gray bodies, as evidenced by the infrared bump in Fig. E.1.
Among the various free parameters available in GalaPy, we fixed specific, physically motivated values and ranges to ensure meaningful results and optimise computational efficiency. Specifically, the redshift for each source was fixed to the value reported in the SIMBAD Astronomical Database6. The number of molecular clouds, NMC, was constrained to a 102.5 − 3.5 range, reflecting a typical population of isolated molecular clouds (MCs) within individual galaxies. Furthermore, the dusty and molecular radii of these clouds were constrained to a characteristic range of 10–1000 pc. A comprehensive compilation of the initial conditions adopted for our SED models is provided in Table E.1, while the resulting diffuse dust (TDD) and molecular cloud (TMC) temperatures are presented in Table E.1, whose lower and upper uncertainties correspond to the 16th and 84th percentiles, respectively, with the main value corresponding to the 50th percentile (median) of the derived parameter.
Initial conditions for GalaPy input values or ranges.
Stellar- and dust-related parameters for all SED results derived from GalaPy. The initial conditions are provided in Table E.1.
 |
Fig. E.1. SED models obtained with the GalaPy software for the studied galaxies, as explained in Appendix E, with available enough photometric observations in the literature. In the main panels, the abscissas and ordinates correspond to the observed wavelength in Ångströms and the flux density in mJy. Points correspond to the photometric measurements obtained from the WISE archive and Meerkat continuum levels (this work), while solid lines correspond to the unattenuated stellar emission (green), molecular cloud component (MC, purple), stellar emission considering extinction (extinct, red), and diffuse dust (DD, yellow). The bottom sub-panels highlight the residuals with 1 and 2σ shaded areas, which are also labelled in the main panels. |
All Tables
Stellar- and dust-related parameters for all SED results derived from GalaPy. The initial conditions are provided in Table E.1.
All Figures
|
Fig. 1. High-resolution MeerKAT 20-cm radio continuum emission of five galaxies overlaid onto DSS optical images. First row: NGC 6221, NGC 6215, and NGC 2442. The radio continuum contour levels of NGC 6221 and NGC 6215 are 0.03, 0.2, 0.5, 1, 3, and 8 mJy beam−1, while for NGC 2442, the levels are 0.027, 0.09, and 0.27 mJy beam−1. Second row: NGC 3256 and NGC 3263. The radio continuum contour levels are 0.027, 0.045, 0.18, 0.45, 0.9, 2.7, and 7.2 mJy beam−1. Contours are shown in black or white for display purposes. The synthesised beam is displayed in the bottom left corner of each panel. |
| In the text | |
|
Fig. 2. Example of source identification and photometry with PHOTUTILS on the WISE W3 image of NGC 3263. From left to right: Original W3 image, background model, background-subtracted galaxy image, and final photometry. The white ellipse indicates the aperture used to measure the total flux density. The green circle corresponds to the 22″ isophote employed for comparison with catalogue values (see text). |
| In the text | |
|
Fig. 3. WISE colour-colour diagram following Cluver et al. (2017). Early-type galaxies with low SFRs are located at the bottom left (W2 − W3 < 2), and star-forming discs are expected to be on the right side (W2 − W3 > 3.5). Intermediate discs are likely to be found between these regions. Above W1 − W2 = 0.8, heating from dusty AGNs primarily influences the mid-infrared emission. Error bars are displayed for each object unless smaller than the symbol. The black line traces the star formation sequence defined by Jarrett et al. (2019). The galaxy represented with a black dot is not detected in our radio continuum images. |
| In the text | |
|
Fig. 4. Infrared-radio correlation using only the PAH component and radio continuum fluxes. Top panel: log(FW3PAH) vs log(F1.3 GHz) for galaxies with enough data (see text), following the legend. Error bars are shown unless smaller than the symbol. A linear fit, log(y) = m ⋅ log(x)+b, is plotted as a black line, with a shaded region indicating a 0.1 dex scatter. Bottom panel: Histogram of the squared differences between observed and fitted values. |
| In the text | |
|
Fig. 5. Star formation rate as a function of stellar mass, both quantities derived from the SED fitting analysis. The dashed line shows the main-sequence relation from Leslie et al. (2020) and the solid black line the best-fit relation from Speagle et al. (2014). The shaded region indicates the 0.3 dex scatter Leslie et al. (2020), Speagle et al. (2014). |
| In the text | |
|
Fig. 6. Resolved spectral index and error maps of the brightest galaxies in our sample. The dark plum colour pinpoints the flat spectral index associated with thermal emission, while orange marks steep spectral values associated with non-thermal emission (English et al. 2024). |
| In the text | |
|
Fig. 7. NGC 3263, NGC 3256C, NGC 3256B, NGC 3256, NGC 6221, and NGC 6215 qW3PAH maps. The colour bar shows the qW3PAH range values. Black contours correspond to errors of 0.005, 0.01, 0.02, and 0.05 in parameter determination. High values of qW3PAH indicate radio-deficiency, while low values indicate radio-excess. |
| In the text | |
|
Fig. C.1. High-resolution MeerKAT 20-cm radio continuum of the galaxies overlaid onto DSS R-band optical images. First row: ESO 138-1, ESO 138-4, and ESO 138-5 (background galaxies, NGC 6221 group), the contour levels are 0.03, 0.2, 0.5, 1, 3 and 8 mJy beam−1. Second row: NGC 2434, ESO 59-G0012, and NGC 2397 (NGC 2442 group), the contour levels are 0.027, 0.09, and 0.27 mJy beam−1. From the third to the fifth rows: ESO263-33, NGC 3256C, NGC 3256A, LEDA 087403, ESO 263-44, ESO 263-46, ESO 263-45 (background galaxy), NGC 3256B and NGC 3261 (NGC 3256/3263 group). The contour levels are 0.027, 0.045, 0.18, 0.45, 0.9, 2.7, and 7.2 mJy beam−1. Contours are shown in black or white for display purposes. The synthesised beam is displayed at the bottom-left corner of each panel. |
| In the text | |
|
Fig. D.1. Source identification and photometry using PHOTUTILS over the WISE W3-band images. From left to right: original W3 image, background model, background-subtracted galaxy image, and final photometry. The white circle indicates the aperture used to measure the total flux density. The green circle corresponds to the 22″ isophote employed for comparison with catalogue values. |
| In the text | |
|
Fig. D.1. continued. |
| In the text | |
|
Fig. D.1. continued. |
| In the text | |
|
Fig. D.2. The qW3PAH value as a function of W3PAH, 1.3 GHz luminosity, stellar mass, and qTIR vs TIR luminosity. Error bars are displayed for each object unless smaller than the symbol. Except for the errors in the mass determination, which are not shown. The solid line is the same as in Yun et al. (2001)q = 2.34. The blue and red dotted lines show the value corresponding to three times larger radio and W3PAH flux density than expected. |
| In the text | |
|
Fig. D.5. Comparison of galaxy SFRs based on 20-cm radio continuum and W3PAH flux densities. The top panel shows the SFR using Eq. 4, which accounts for stars with masses > 5 M⊙, while the bottom panel accounts for stars with masses > 0.1 M⊙. The linear function plotted represents the 1:1 relation; the shaded region indicates the 10% scatter. |
| In the text | |
|
Fig. D.6. Comparison of the qW3PAH parameter with global spectral index. Error bars, in the spectral index determination, are displayed for each object. The dotted line at q = 2.34 corresponds to the value found by Yun et al. (2001), and the dotted line at α = −0.8 marks the classical value, which is adopted to show the predominance of non-thermal emission. |
| In the text | |
|
Fig. D.7. Comparison of qW3PAH parameters and merger stage. The dashed line is the same as in Yun et al. (2001, q = 2.34), and the dotted lines show the value corresponding to five times larger radio or FIR flux density than expected. |
| In the text | |
|
Fig. E.1. SED models obtained with the GalaPy software for the studied galaxies, as explained in Appendix E, with available enough photometric observations in the literature. In the main panels, the abscissas and ordinates correspond to the observed wavelength in Ångströms and the flux density in mJy. Points correspond to the photometric measurements obtained from the WISE archive and Meerkat continuum levels (this work), while solid lines correspond to the unattenuated stellar emission (green), molecular cloud component (MC, purple), stellar emission considering extinction (extinct, red), and diffuse dust (DD, yellow). The bottom sub-panels highlight the residuals with 1 and 2σ shaded areas, which are also labelled in the main panels. |
| In the text | |
Current usage metrics show cumulative count of Article Views (full-text article views including HTML views, PDF and ePub downloads, according to the available data) and Abstracts Views on Vision4Press platform.
Data correspond to usage on the plateform after 2015. The current usage metrics is available 48-96 hours after online publication and is updated daily on week days.
Initial download of the metrics may take a while.