Fig. D.5.
Download original image
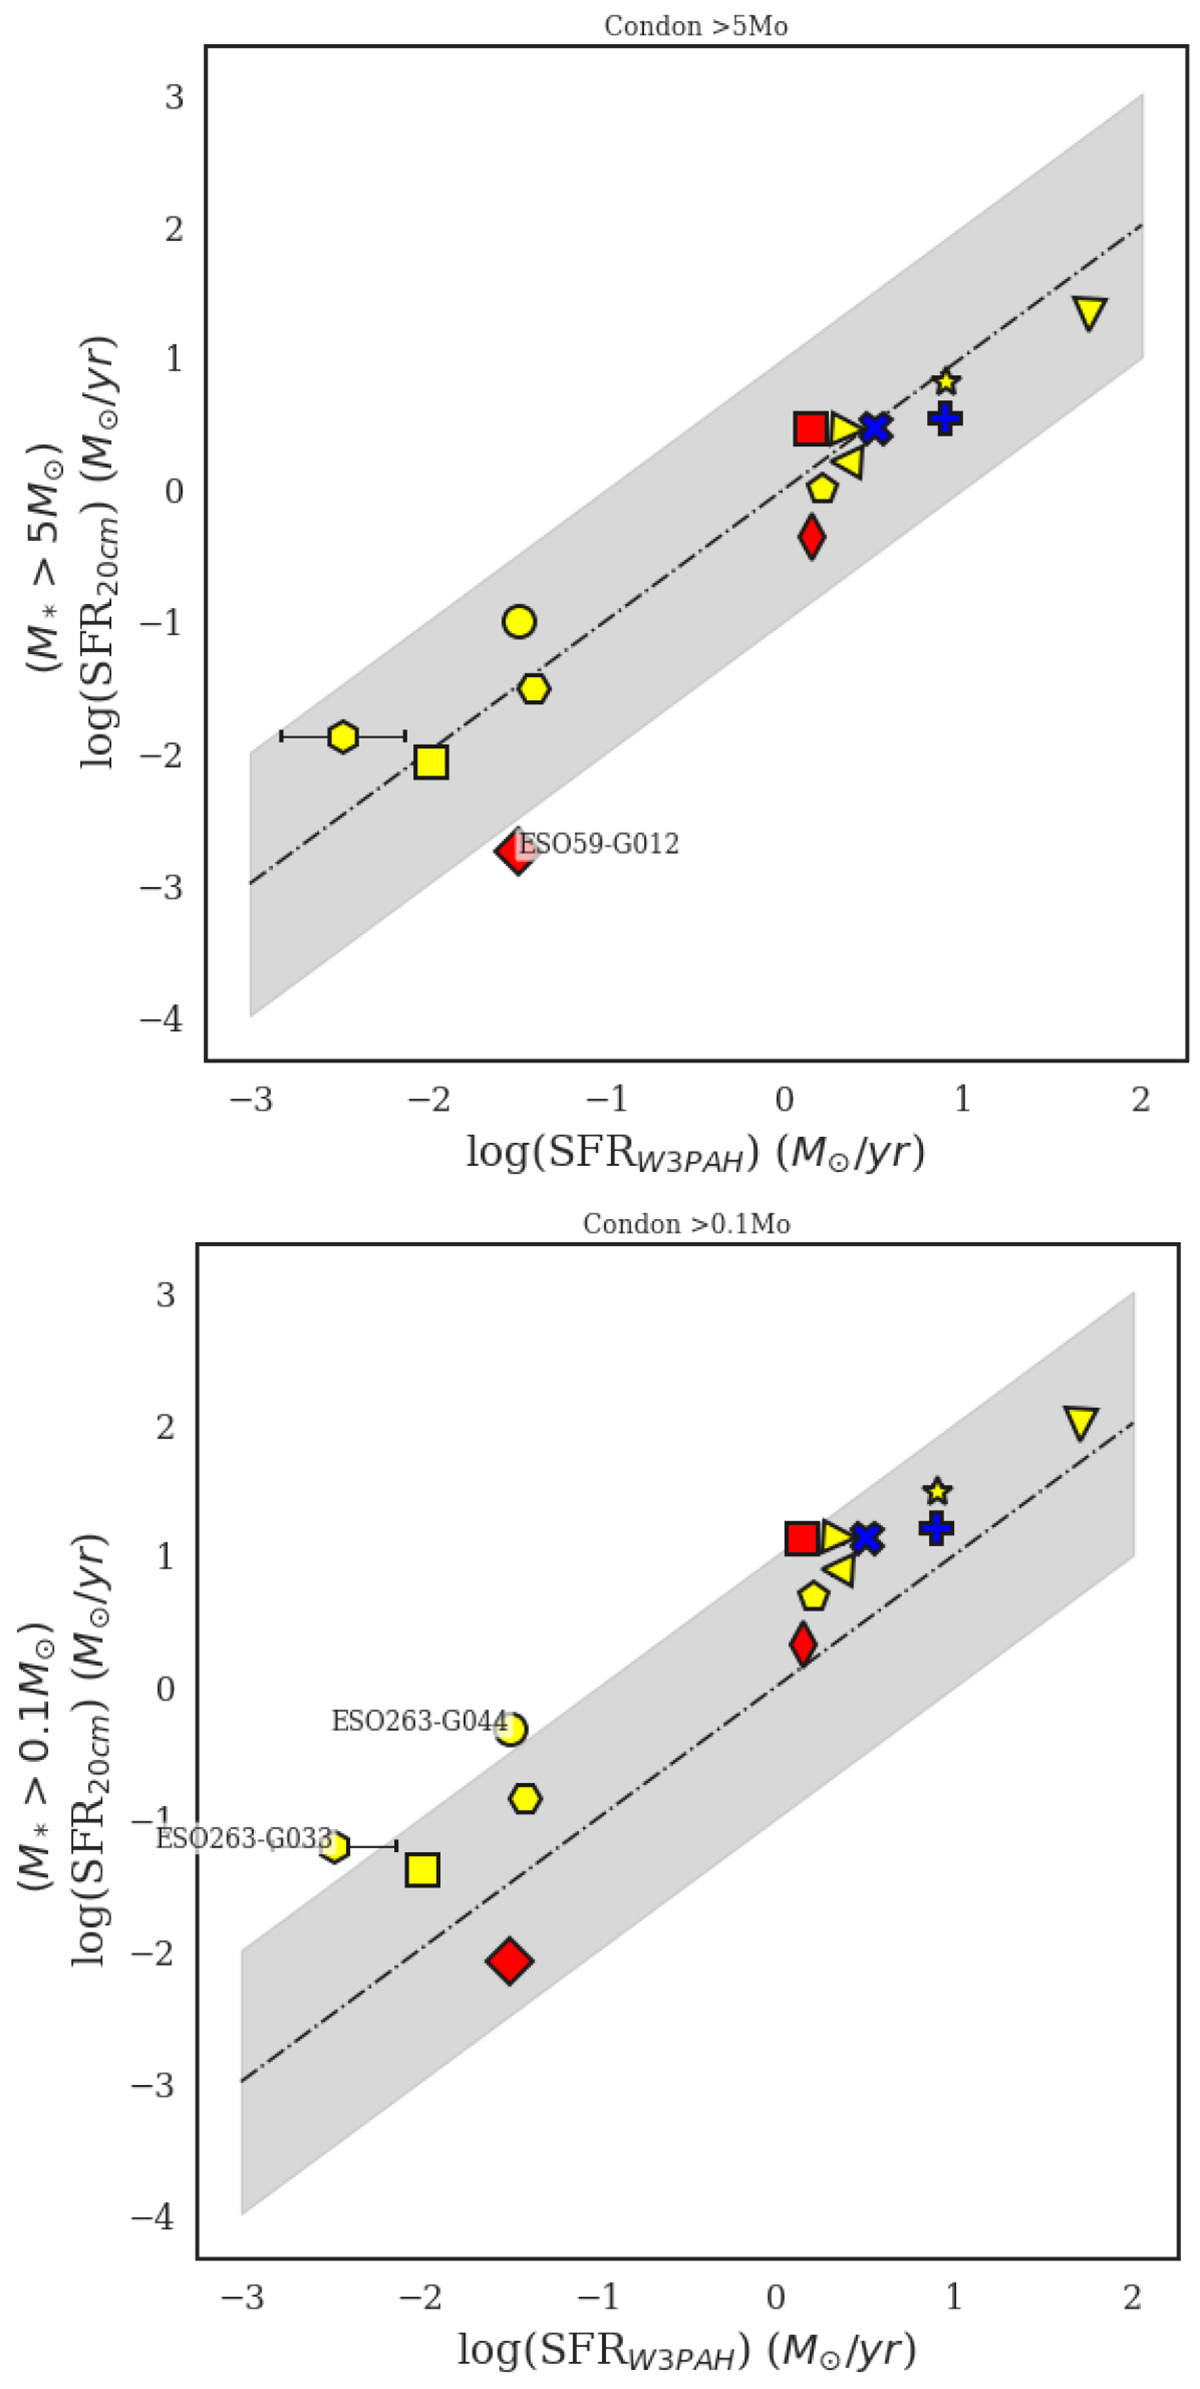
Comparison of galaxy SFRs based on 20-cm radio continuum and W3PAH flux densities. The top panel shows the SFR using Eq. 4, which accounts for stars with masses > 5 M⊙, while the bottom panel accounts for stars with masses > 0.1 M⊙. The linear function plotted represents the 1:1 relation; the shaded region indicates the 10% scatter.
Current usage metrics show cumulative count of Article Views (full-text article views including HTML views, PDF and ePub downloads, according to the available data) and Abstracts Views on Vision4Press platform.
Data correspond to usage on the plateform after 2015. The current usage metrics is available 48-96 hours after online publication and is updated daily on week days.
Initial download of the metrics may take a while.