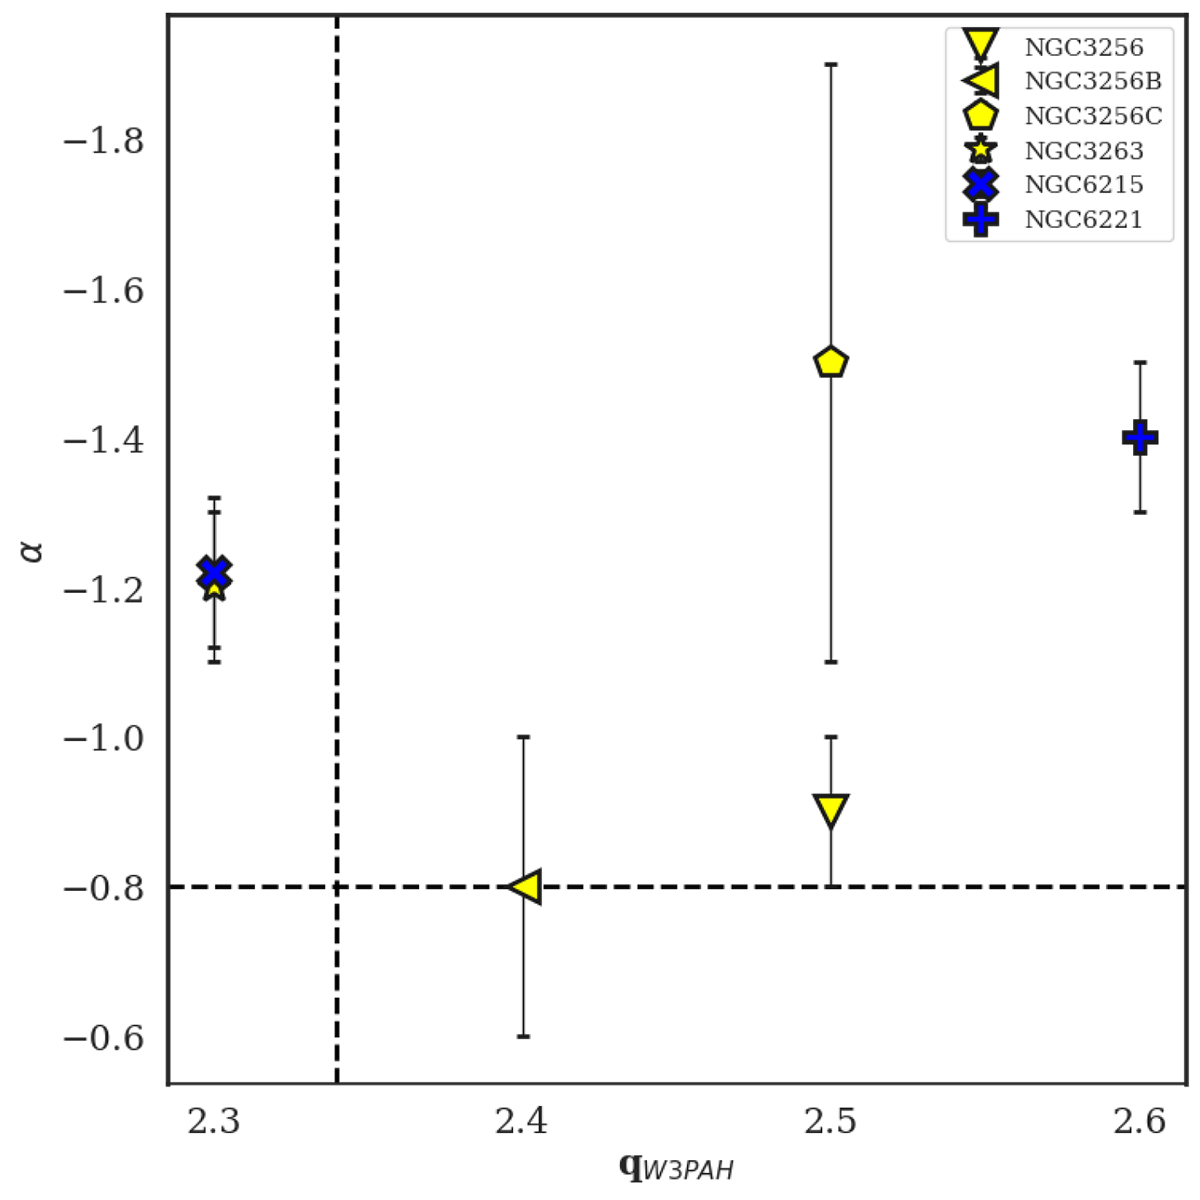
Fig. D.6.
Download original image
Comparison of the qW3PAH parameter with global spectral index. Error bars, in the spectral index determination, are displayed for each object. The dotted line at q = 2.34 corresponds to the value found by Yun et al. (2001), and the dotted line at α = −0.8 marks the classical value, which is adopted to show the predominance of non-thermal emission.
Current usage metrics show cumulative count of Article Views (full-text article views including HTML views, PDF and ePub downloads, according to the available data) and Abstracts Views on Vision4Press platform.
Data correspond to usage on the plateform after 2015. The current usage metrics is available 48-96 hours after online publication and is updated daily on week days.
Initial download of the metrics may take a while.