Fig. 4.
Download original image
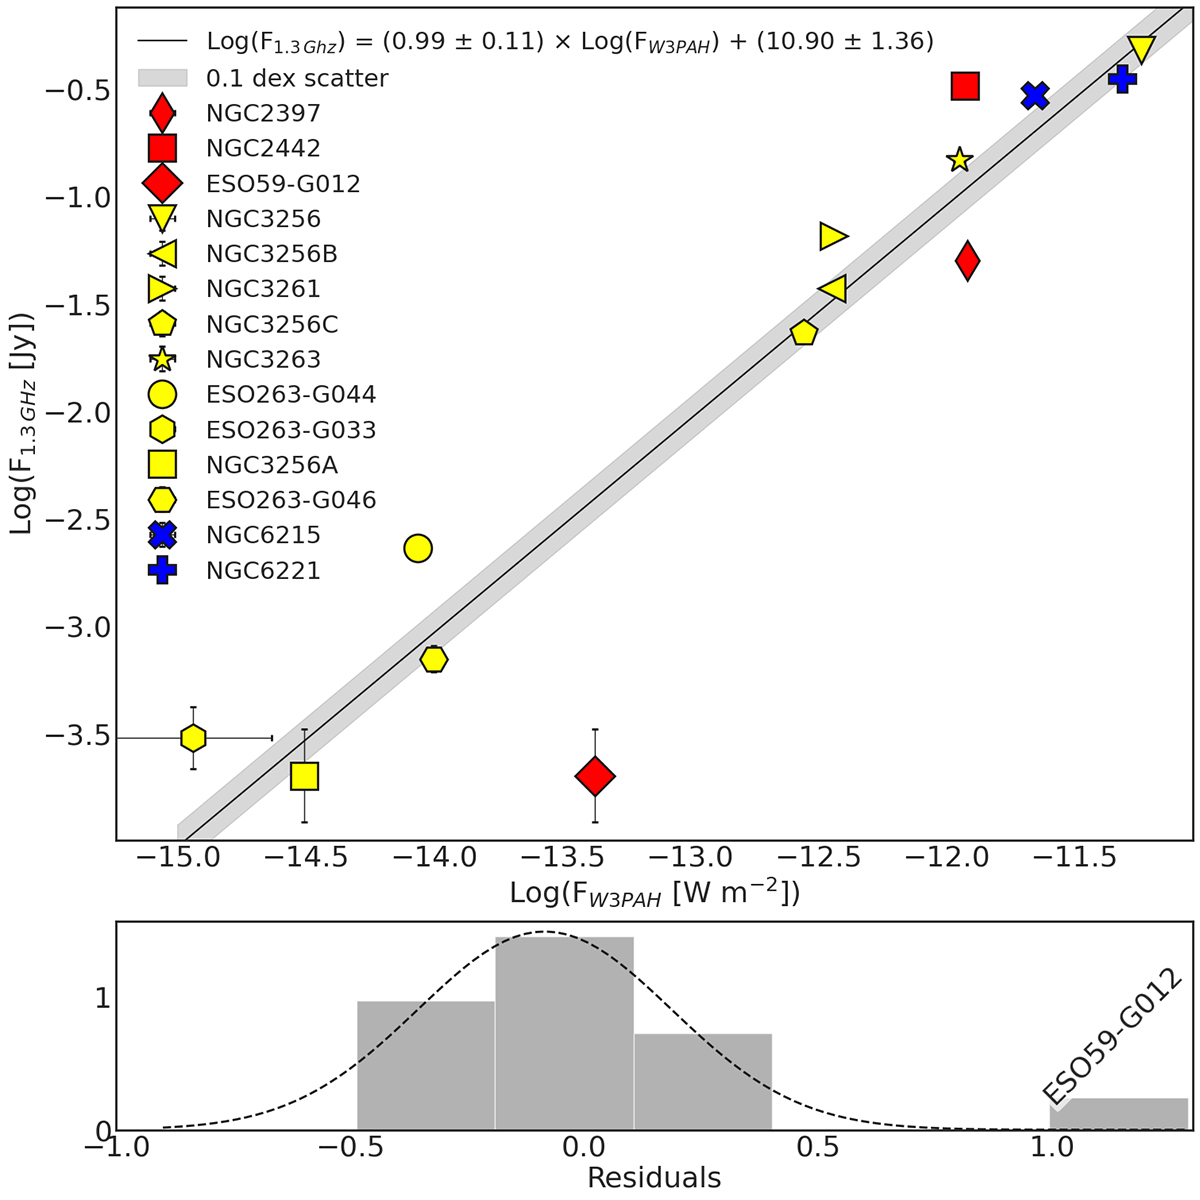
Infrared-radio correlation using only the PAH component and radio continuum fluxes. Top panel: log(FW3PAH) vs log(F1.3 GHz) for galaxies with enough data (see text), following the legend. Error bars are shown unless smaller than the symbol. A linear fit, log(y) = m ⋅ log(x)+b, is plotted as a black line, with a shaded region indicating a 0.1 dex scatter. Bottom panel: Histogram of the squared differences between observed and fitted values.
Current usage metrics show cumulative count of Article Views (full-text article views including HTML views, PDF and ePub downloads, according to the available data) and Abstracts Views on Vision4Press platform.
Data correspond to usage on the plateform after 2015. The current usage metrics is available 48-96 hours after online publication and is updated daily on week days.
Initial download of the metrics may take a while.