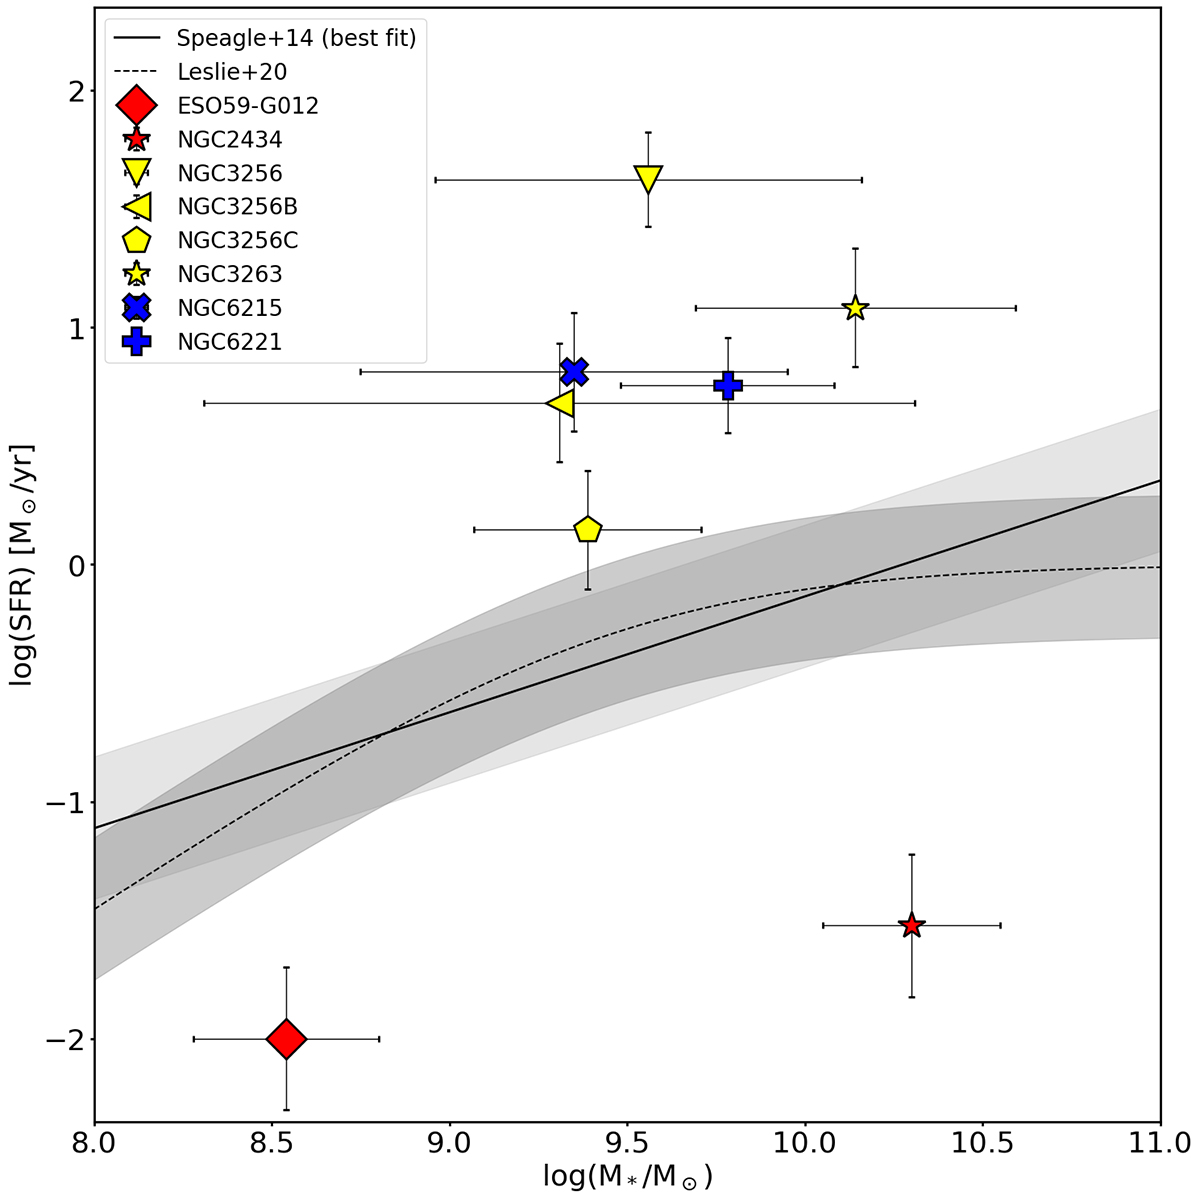
Fig. 5.
Download original image
Star formation rate as a function of stellar mass, both quantities derived from the SED fitting analysis. The dashed line shows the main-sequence relation from Leslie et al. (2020) and the solid black line the best-fit relation from Speagle et al. (2014). The shaded region indicates the 0.3 dex scatter Leslie et al. (2020), Speagle et al. (2014).
Current usage metrics show cumulative count of Article Views (full-text article views including HTML views, PDF and ePub downloads, according to the available data) and Abstracts Views on Vision4Press platform.
Data correspond to usage on the plateform after 2015. The current usage metrics is available 48-96 hours after online publication and is updated daily on week days.
Initial download of the metrics may take a while.