Open Access
Fig. 7.
Download original image
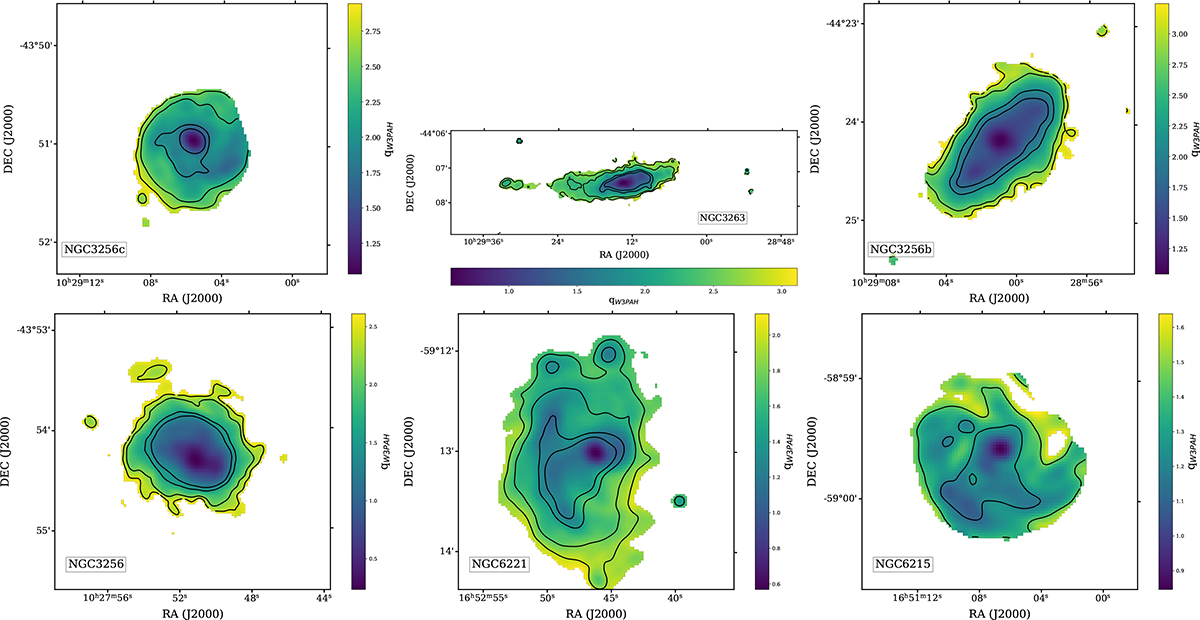
NGC 3263, NGC 3256C, NGC 3256B, NGC 3256, NGC 6221, and NGC 6215 qW3PAH maps. The colour bar shows the qW3PAH range values. Black contours correspond to errors of 0.005, 0.01, 0.02, and 0.05 in parameter determination. High values of qW3PAH indicate radio-deficiency, while low values indicate radio-excess.
Current usage metrics show cumulative count of Article Views (full-text article views including HTML views, PDF and ePub downloads, according to the available data) and Abstracts Views on Vision4Press platform.
Data correspond to usage on the plateform after 2015. The current usage metrics is available 48-96 hours after online publication and is updated daily on week days.
Initial download of the metrics may take a while.