Fig. A.3
Download original image
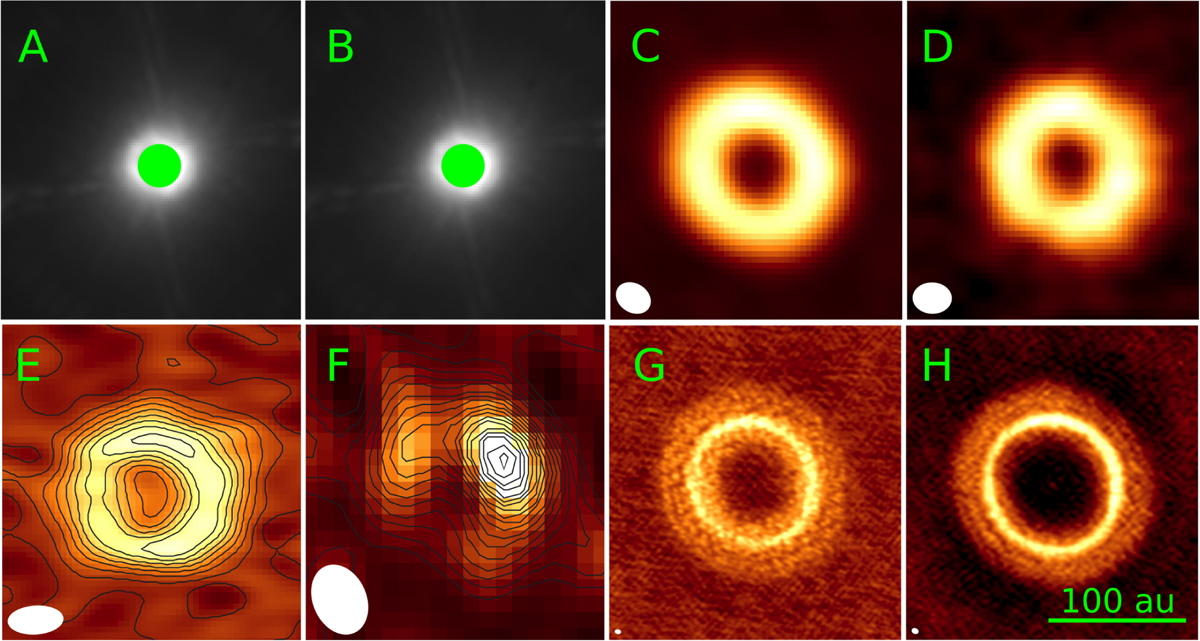
Comparison of available spatially resolved observations of DoAr 44. A: VLT/SPHERE/IRDIS Channel 1 (Avenhaus et al. 2018). B: VLT/SPHERE/IRDIS Channel 2 (Avenhaus et al. 2018). C: ALMA Band 3. Angular resolution: 0.251”. Project code: 2019.1.01111.S. D: ALMA Band 7.0.168” (Arce-Tord et al. 2023). E: ALMA Band 8. 0.154” (Casassus et al. 2023). F: SMA at 346 GHz. 0.41” (van der Marel et al. 2016). G: ALMA Band 7. 0.023” (Arce-Tord et al. 2023). H: ALMA Band 6. 0.026” (Cieza et al. 2021). The SPHERE images are in the H band, and correspond to perpendicular linear polarisations. The green circle on the SPHERE images is the 0.1 “radial extent of the coronagraph. Contours are plotted over the low-resolution interferometric images. The synthesised beam, corresponding to the angular resolution, is shown as a white ellipse (very small for plots G and H). The scale is consistent on all plots. These ALMA observations were also used to constrain the model of the SED.
Current usage metrics show cumulative count of Article Views (full-text article views including HTML views, PDF and ePub downloads, according to the available data) and Abstracts Views on Vision4Press platform.
Data correspond to usage on the plateform after 2015. The current usage metrics is available 48-96 hours after online publication and is updated daily on week days.
Initial download of the metrics may take a while.