Open Access
Fig. 4
Download original image
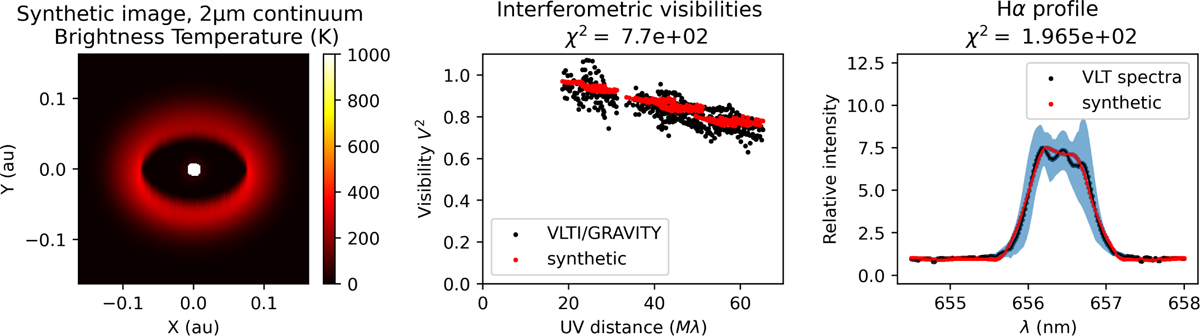
Left: Synthetic image of the accretion region, in the 2 μm continuum. Centre: fit of VLTI/GRAVITY squared visibilities. Right: fit of the averaged Hα profile. The blue region is the standard deviation of the VLT spectra, representing the temporal variability.
Current usage metrics show cumulative count of Article Views (full-text article views including HTML views, PDF and ePub downloads, according to the available data) and Abstracts Views on Vision4Press platform.
Data correspond to usage on the plateform after 2015. The current usage metrics is available 48-96 hours after online publication and is updated daily on week days.
Initial download of the metrics may take a while.