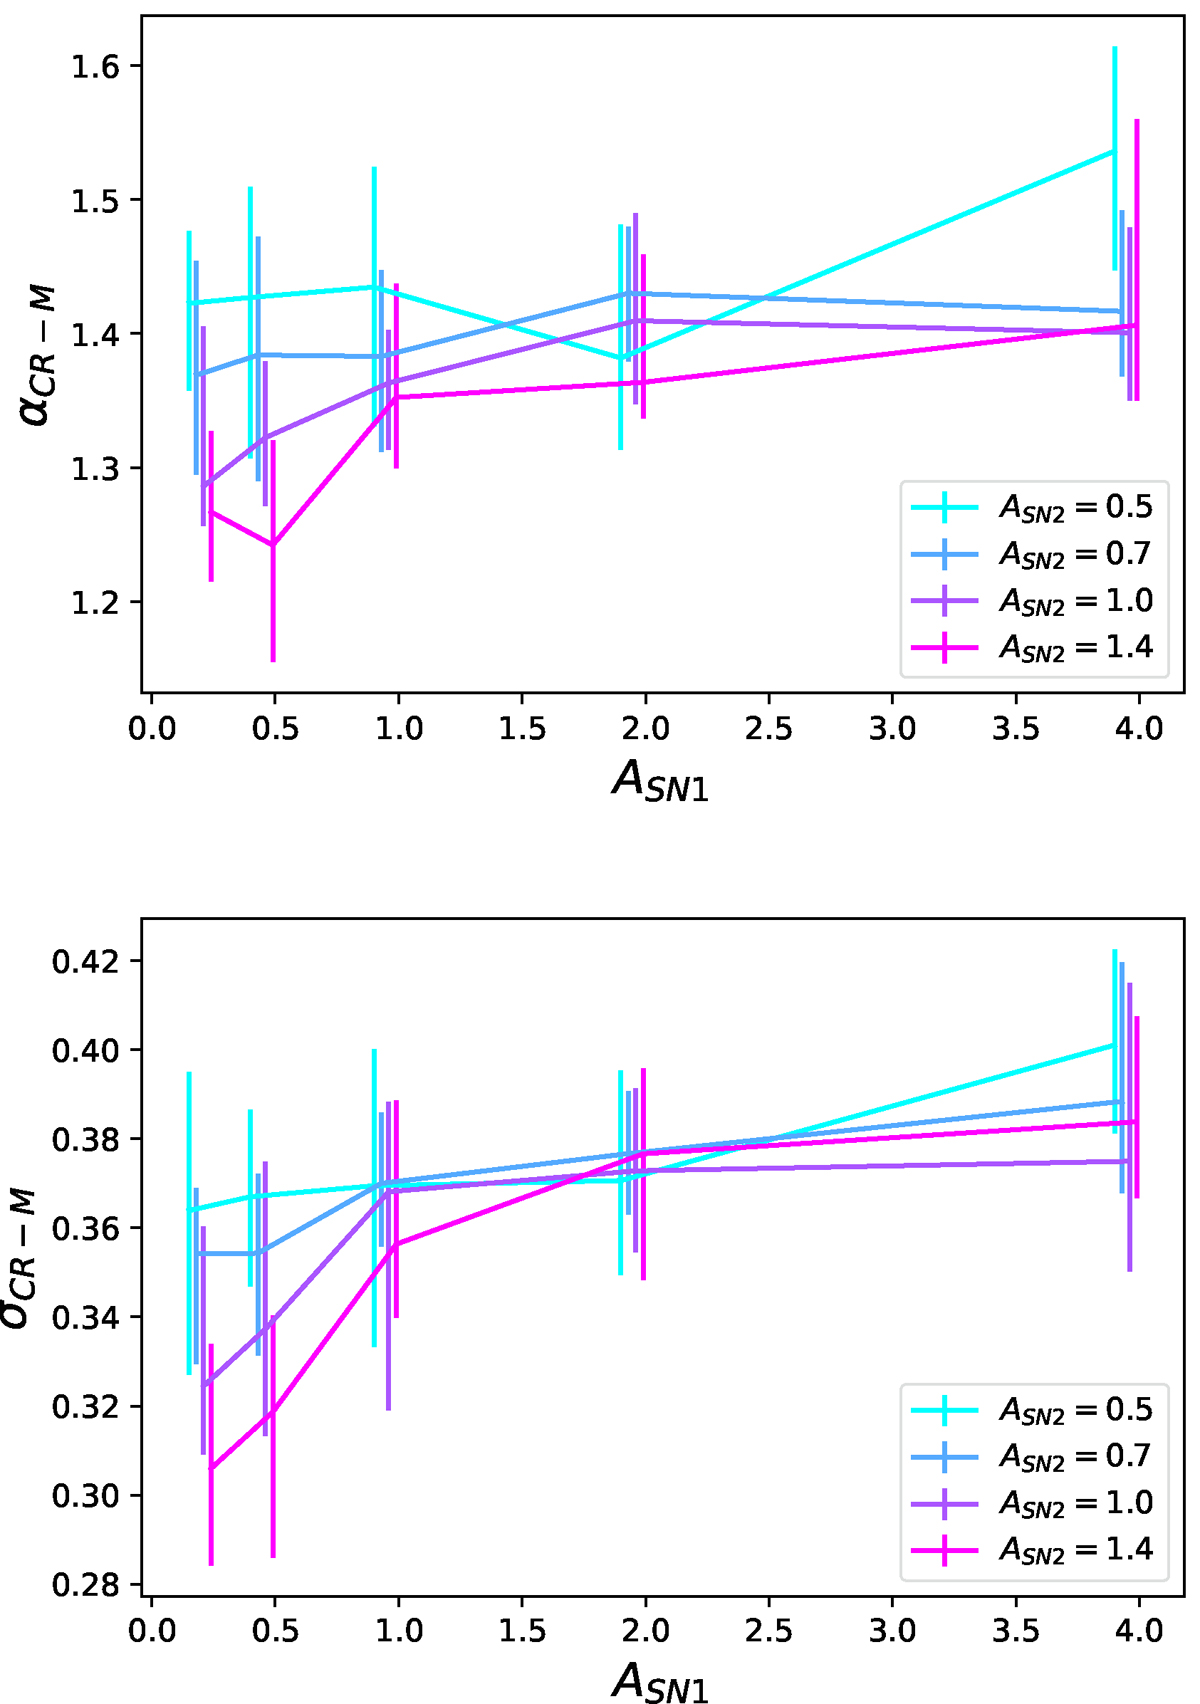
Fig. 14.
Download original image
CR–M relation coefficients as a function of simulation parameters, for large volumes emulated at z = 0.21. The x-axis varies the ASN1 feedback parameter, while the line colour denotes a change in ASN2. The top and bottom panels respectively show the variations of the slope αCR − M and of the intrinsic scatter σCR − M. The error bars show the interval covering 68% of the measured point around the median. The lines have been slightly shifted horizontally to improve readability.
Current usage metrics show cumulative count of Article Views (full-text article views including HTML views, PDF and ePub downloads, according to the available data) and Abstracts Views on Vision4Press platform.
Data correspond to usage on the plateform after 2015. The current usage metrics is available 48-96 hours after online publication and is updated daily on week days.
Initial download of the metrics may take a while.