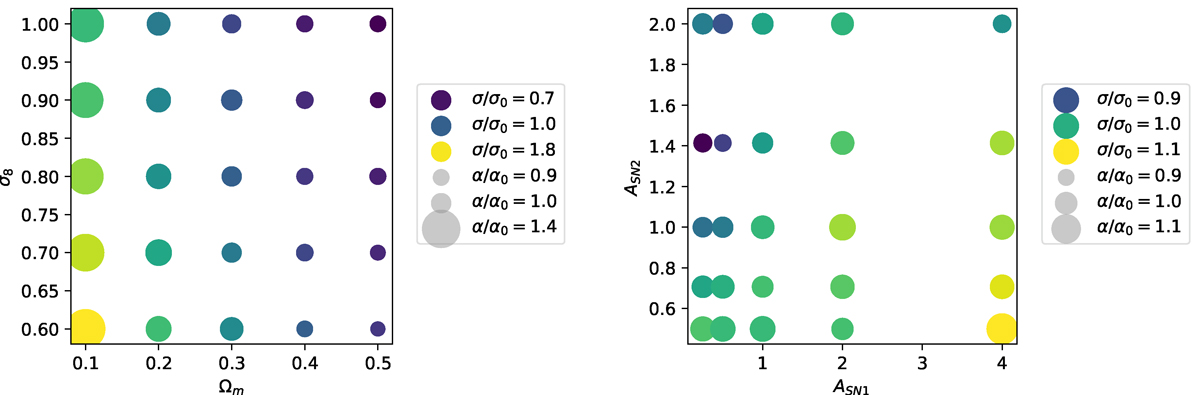
Fig. C.1.
Download original image
4D view of the dependance of the scaling relation coefficients on the simulation parameters. The marker size denotes the value of the scaling relation slope, and the marker color represents its dispersion. Both quantities are normalized with respect to the scaling relation of the fiducial model (central point). Top: Variation of the CR-M slope and scatter when varying Ωm, σ8, sampled on a linear grid. Bottom: Variation of the CR-M slope and scatter when varying ASN1 and ASN2, sampled on a logarithmic grid.
Current usage metrics show cumulative count of Article Views (full-text article views including HTML views, PDF and ePub downloads, according to the available data) and Abstracts Views on Vision4Press platform.
Data correspond to usage on the plateform after 2015. The current usage metrics is available 48-96 hours after online publication and is updated daily on week days.
Initial download of the metrics may take a while.