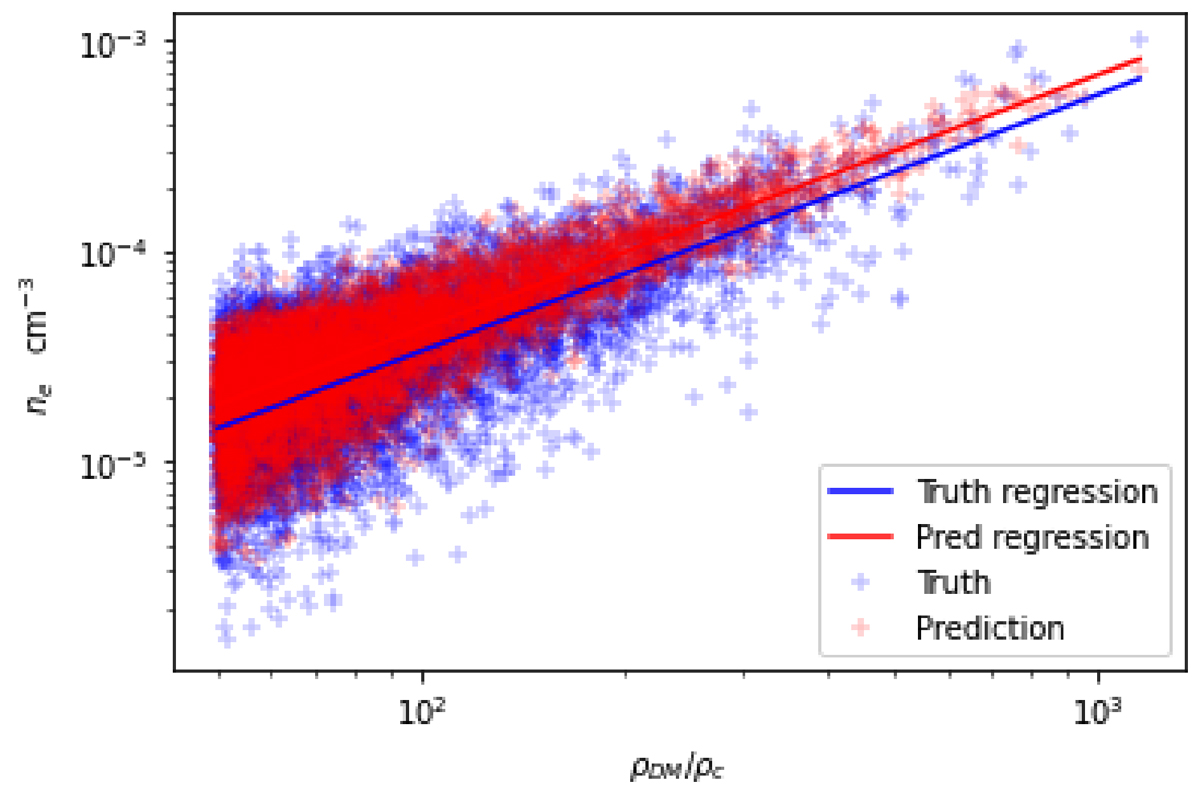
Fig. 5.
Download original image
Relation between electron number density, ne, and the DM density for the hydrodynamical simulations (blue crosses) and the LDL surrogate (red crosses) for the fiducial parameters and at z = 0.21. The blue and red lines denote the mean locus (respectively for the hydrodynamical and the LDL-predicted voxels). The voxel deviation from the mean for both methods is quite correlated (ρcorr = 0.56), but the LDL predictions do not reproduce the same scatter as in the originalsimulations.
Current usage metrics show cumulative count of Article Views (full-text article views including HTML views, PDF and ePub downloads, according to the available data) and Abstracts Views on Vision4Press platform.
Data correspond to usage on the plateform after 2015. The current usage metrics is available 48-96 hours after online publication and is updated daily on week days.
Initial download of the metrics may take a while.