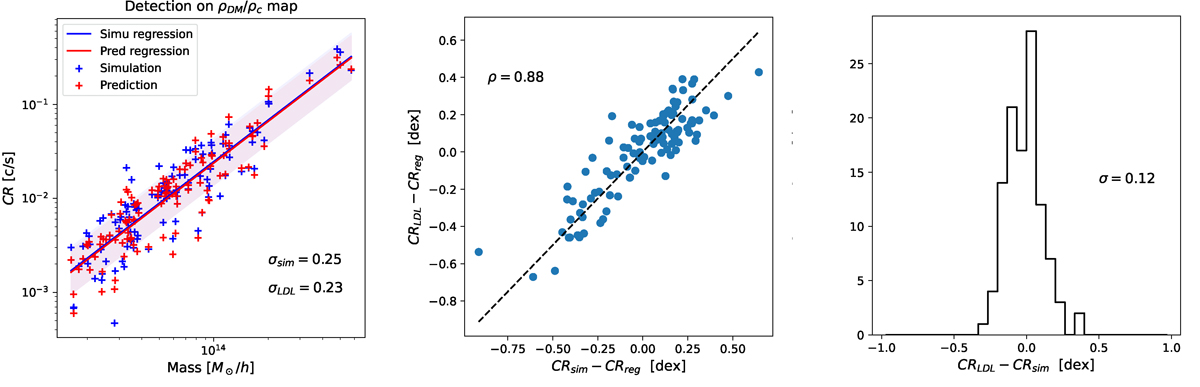
Fig. 6.
Download original image
CR − M scaling relation at z = 0.21 in CAMELS/IllustrisTNG simulations and in their LDL surrogate, for the fiducial model. These plots were done with the CV test set: 6 boxes with a volume of (50h−1 Mpc)3 each. Left: Direct comparison of hydrodynamical simulated clusters (blue crosses) and their LDL counterpart (red crosses). The plain lines and shaded region indicate respectively the mean relation and scatter for each method. The scaling relation is well reproduced by the LDL method. Middle: Deviation of hydrodynamical values and LDL prediction to the mean relation (blue points), and the 1:1 slope (dashed line). The strong correlation indicates that the LDL recovers more than just a scaling relation: it can learn why a specific cluster is over or under luminous, given its mass, thanks to its 3D DM distribution. Right: Histogram of CR prediction errors. At the cluster level, the LDL prediction appears unbiased, and with a scatter of 0.12 dex, smaller than the natural scatter of the CR − M relation.
Current usage metrics show cumulative count of Article Views (full-text article views including HTML views, PDF and ePub downloads, according to the available data) and Abstracts Views on Vision4Press platform.
Data correspond to usage on the plateform after 2015. The current usage metrics is available 48-96 hours after online publication and is updated daily on week days.
Initial download of the metrics may take a while.