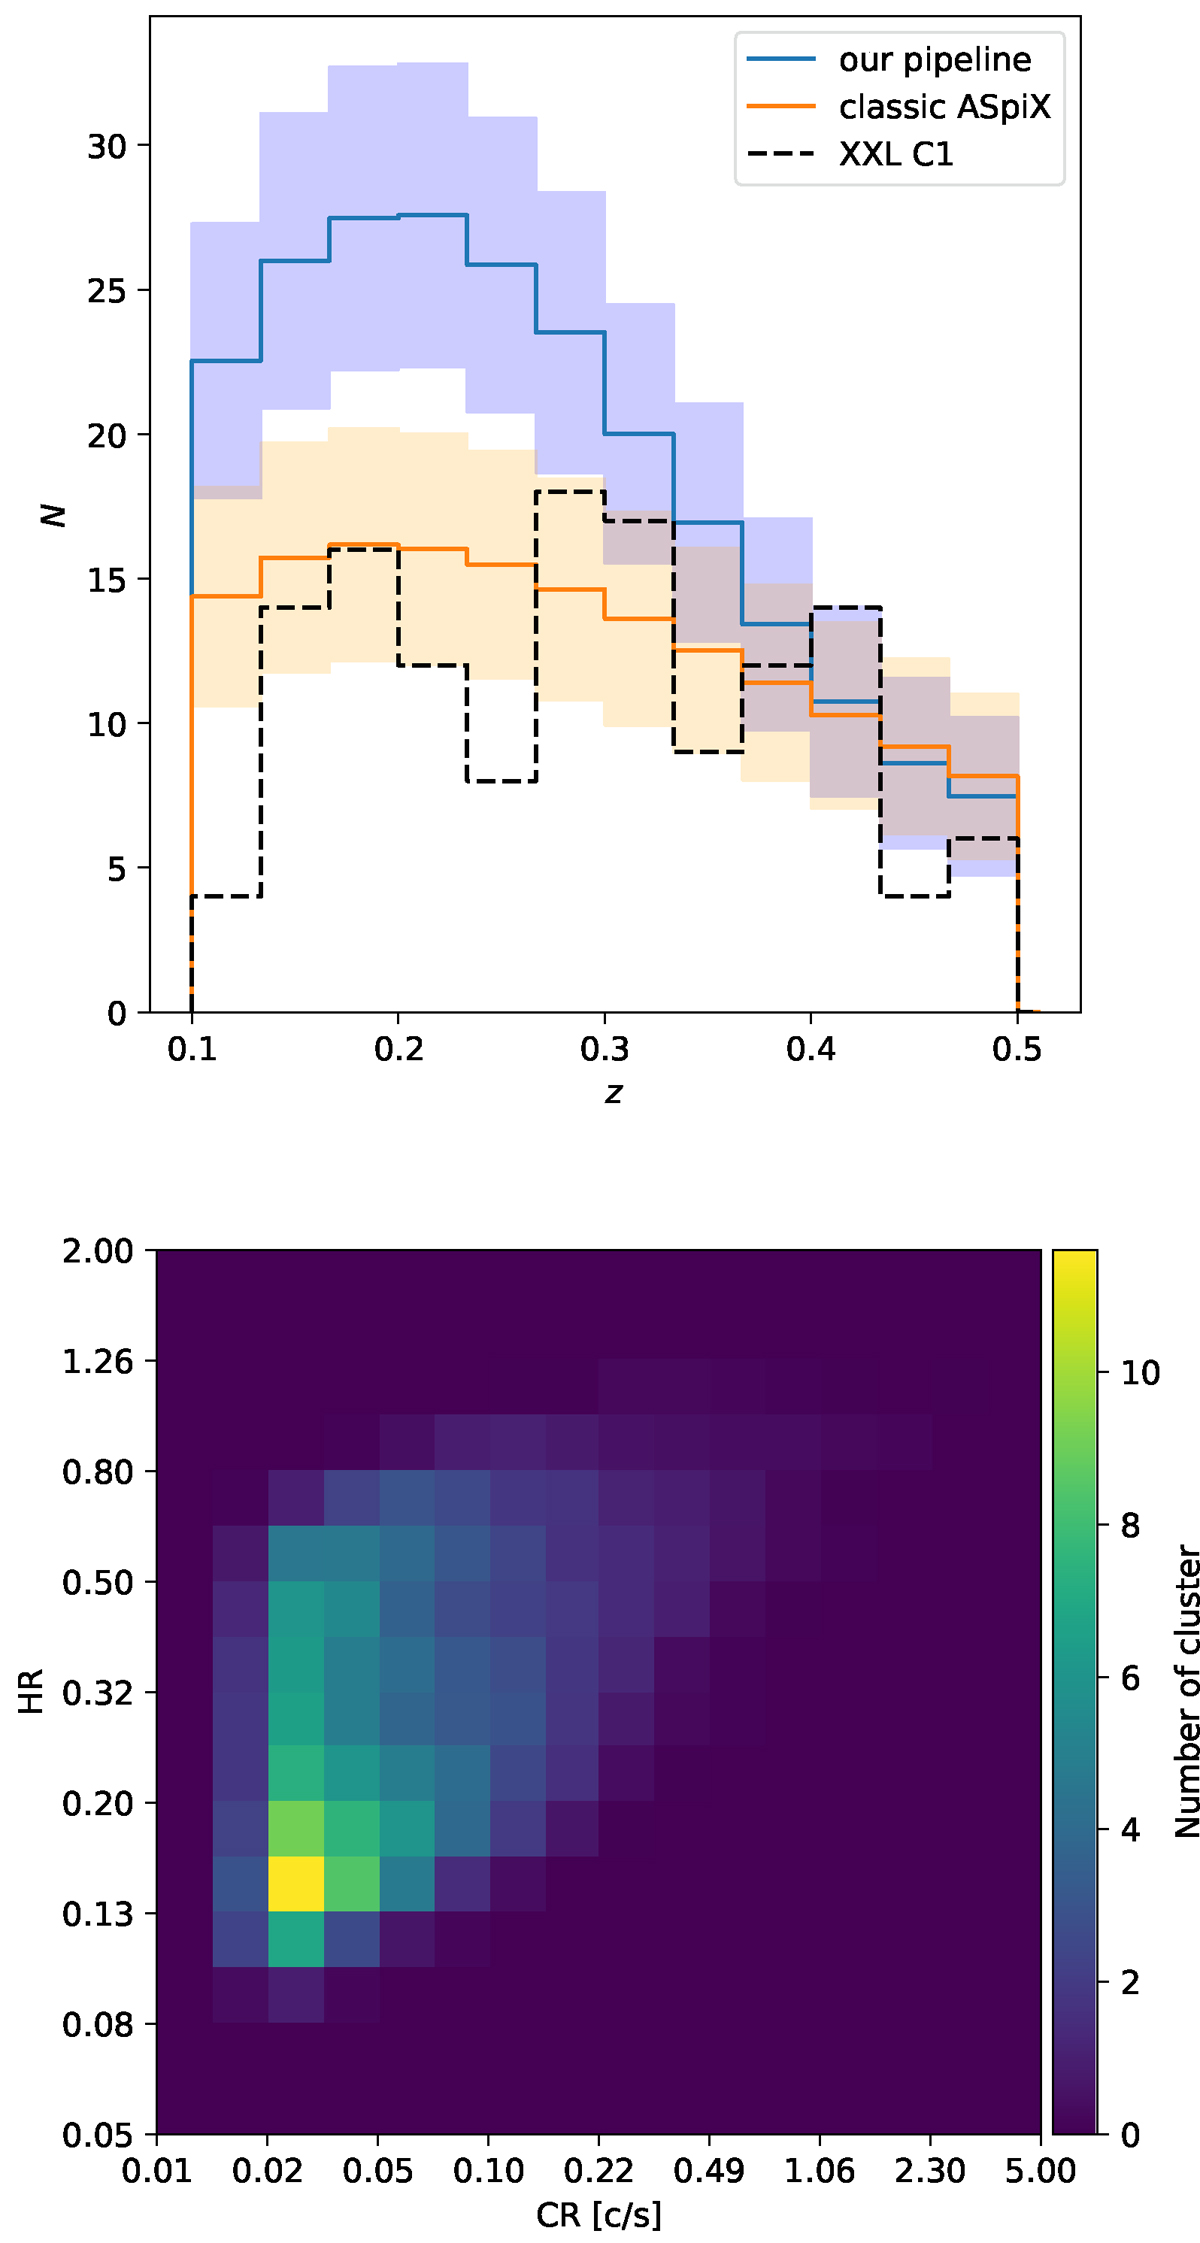
Fig. 7.
Download original image
Top: Redshift distribution of cluster counts for traditional forward model (with explicit scaling relations, orange histogram) and for the simulation-based model (with the LDL, blue histogram), here for a 50 deg2 survey extending from z = 0.1 to z = 0.5. The shaded regions display the 3σ Poisson standard deviation for each model. Also shown is the observed distribution of C1 clusters in the XXL Survey (dashed black histogram), however one should keep in mind that the selection function is in this case more complex than a simple flux cut. We stress that this Figure is not a goodness of fit: both models are calibrated independently. Bottom: Cluster population in CR–HR space for simulation-based model, also for a 50 deg2 survey extending from z = 0.1 to z = 0.5. The CR and HR in the simulation-based and scaling-relation-based models are computed differently; hence we did not compare their distributions.
Current usage metrics show cumulative count of Article Views (full-text article views including HTML views, PDF and ePub downloads, according to the available data) and Abstracts Views on Vision4Press platform.
Data correspond to usage on the plateform after 2015. The current usage metrics is available 48-96 hours after online publication and is updated daily on week days.
Initial download of the metrics may take a while.