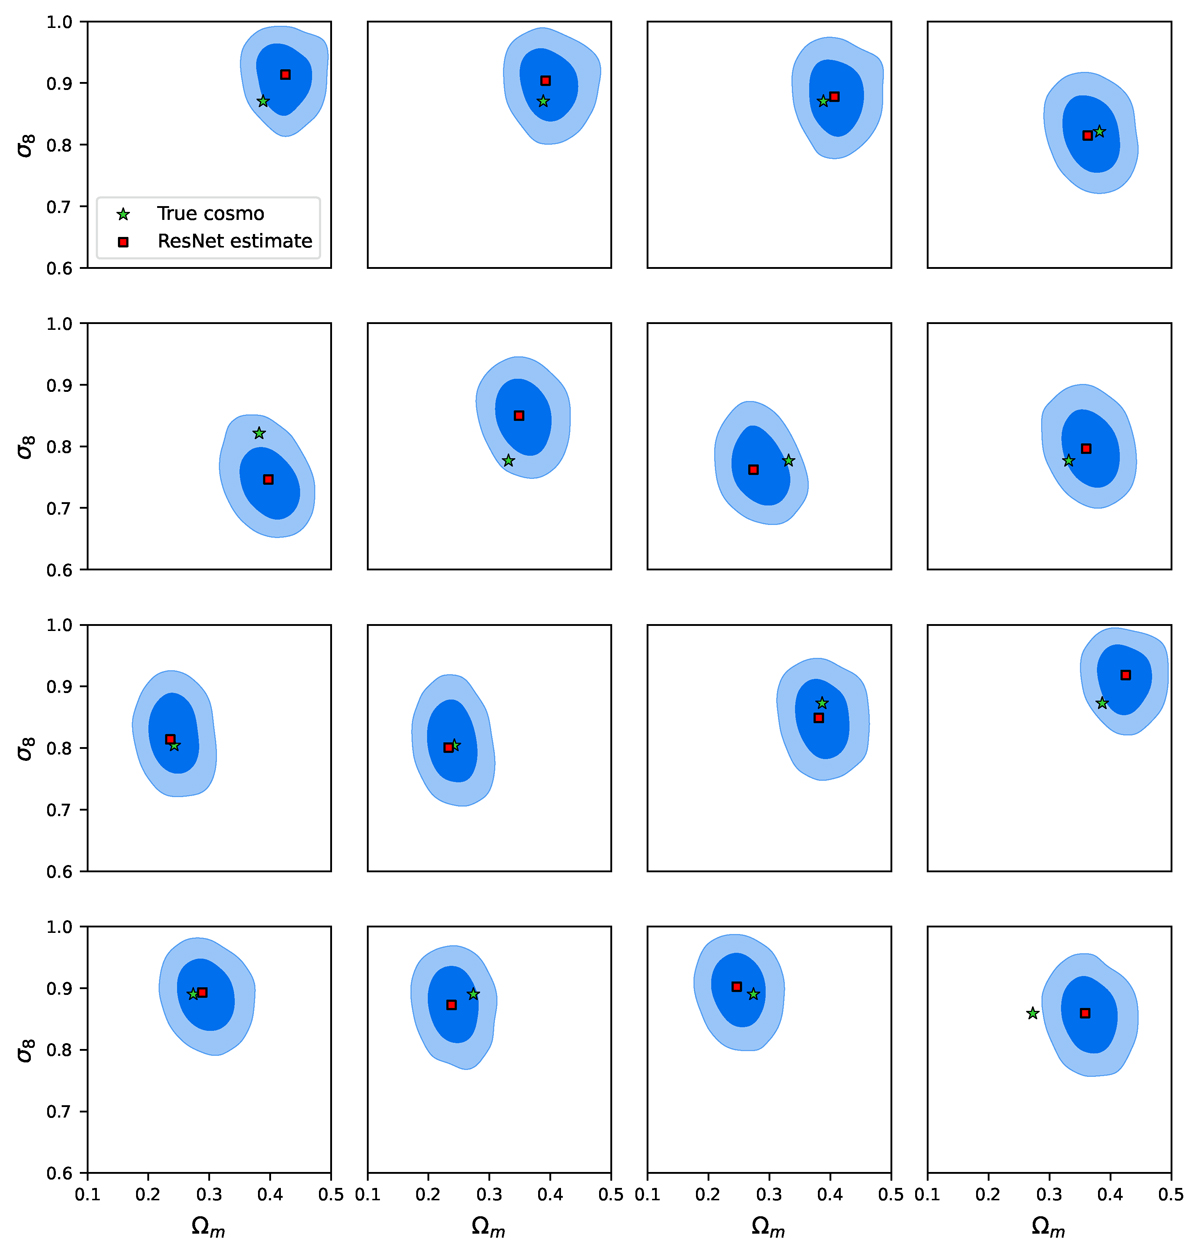
Fig. 9.
Download original image
NPE performed at different points in parameter space. XODs are produced from 200 deg2 X-ray surveys, selecting clusters with the flux cut CRlim = 0.02c/s. The posteriors (blue contours) are obtained with the NPE for XODs not seen during the ResNet or NPE trainings. A tested XOD x0 is compressed into a y0, the position of which in the parameter space is indicated by a red square. The green star shows the true parameters that were used to simulate x0.
Current usage metrics show cumulative count of Article Views (full-text article views including HTML views, PDF and ePub downloads, according to the available data) and Abstracts Views on Vision4Press platform.
Data correspond to usage on the plateform after 2015. The current usage metrics is available 48-96 hours after online publication and is updated daily on week days.
Initial download of the metrics may take a while.