Fig. 1
Download original image
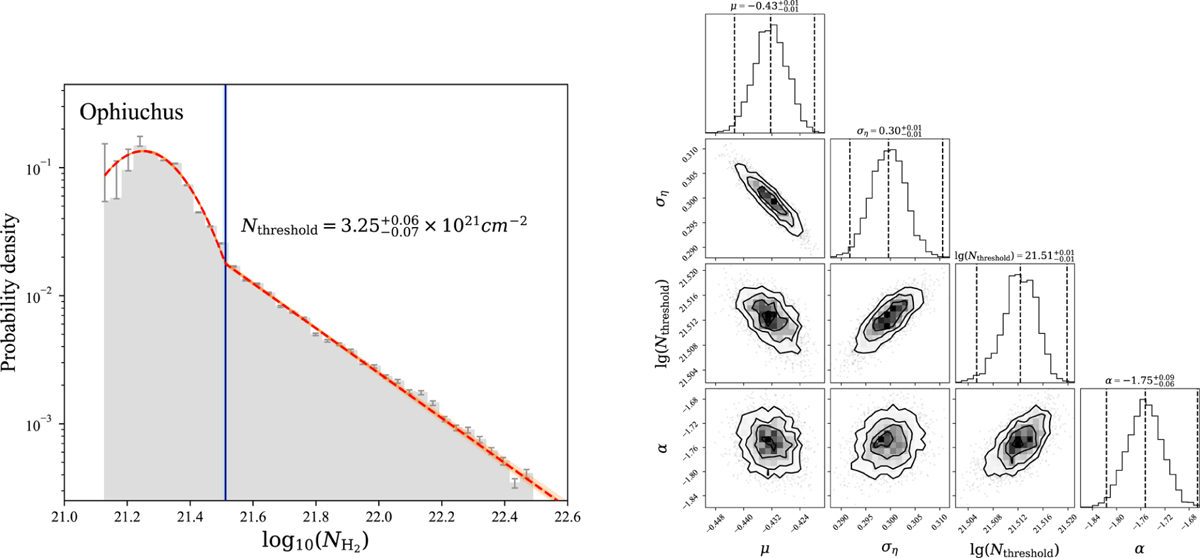
An example of the N-PDF fitting. Left: the N-PDF of Ophiuchus (gray histogram). The error bars at the lower-density end show the uncertainties due to the map area. The orange line shows the fitted curve and the black vertical line shows the fitted threshold column density. Right: corner plot of the fitted parameters. ση represents the dimensionless dispersion, and μ is the mean of the lognormal component. Nthreshold is the transitional column density, related to ηt via the relation ηt = ln(Nthreshold/⟨NH2⟩). α denotes the slope of the power-law tail.
Current usage metrics show cumulative count of Article Views (full-text article views including HTML views, PDF and ePub downloads, according to the available data) and Abstracts Views on Vision4Press platform.
Data correspond to usage on the plateform after 2015. The current usage metrics is available 48-96 hours after online publication and is updated daily on week days.
Initial download of the metrics may take a while.