Fig. 3
Download original image
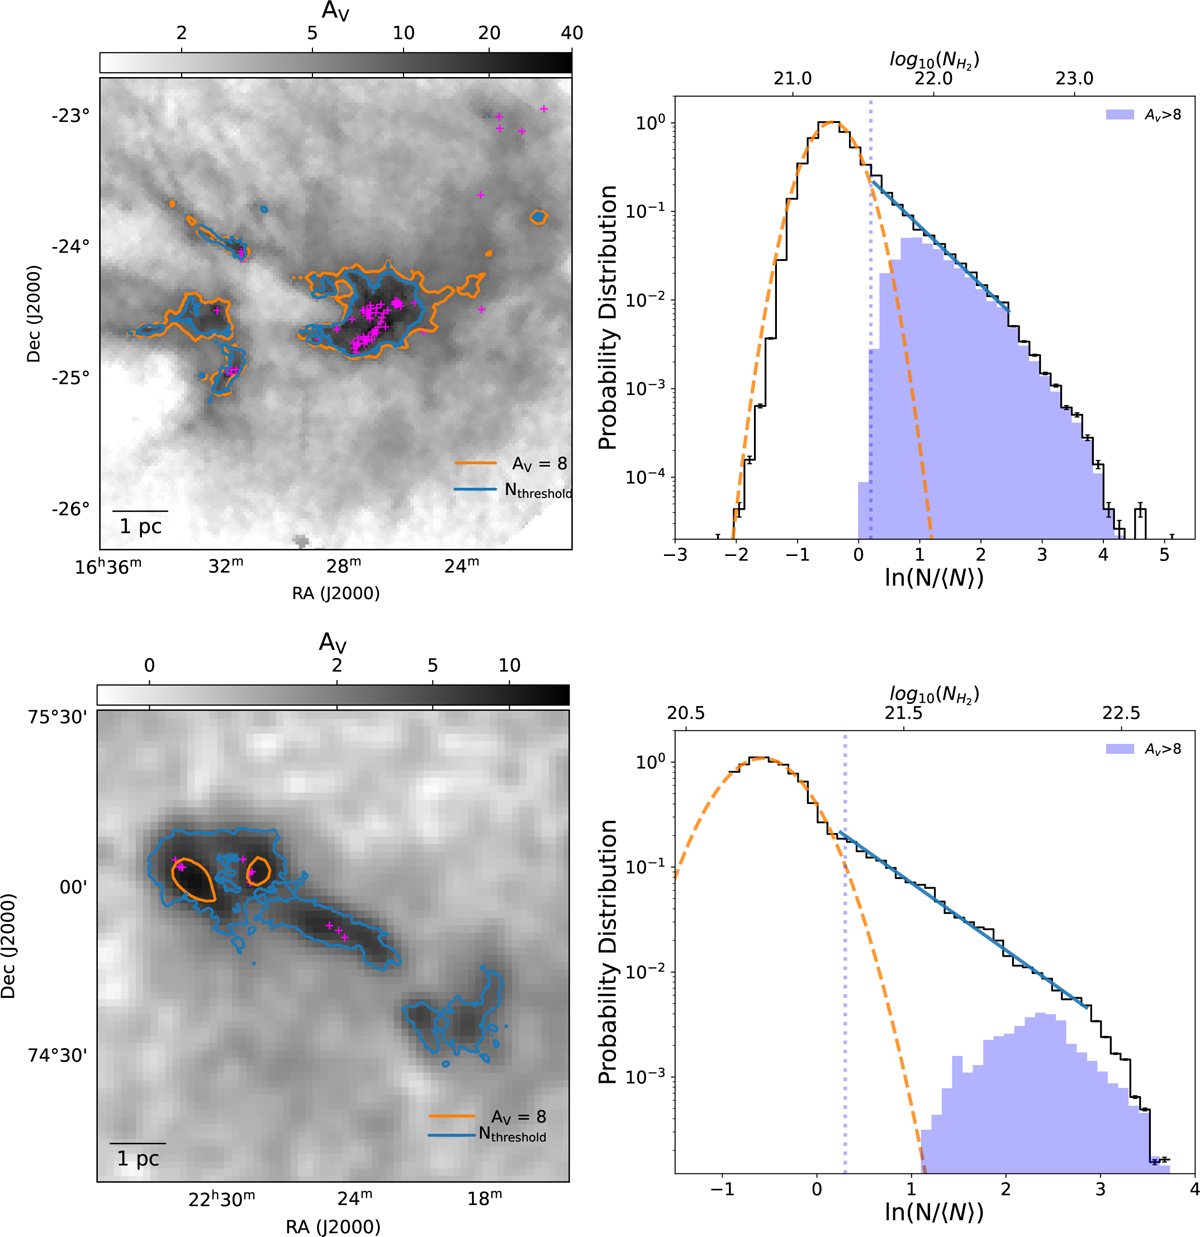
Example Av maps and N-PDFs. Left: Av maps of Ophiuchus and Cepheus I (Zucker et al. 2021). The orange contours trace AV = 8 mag, while the blue contours trace Nthreshold. The young embedded protostars (Class 0, I, and Flatspectrum sources) are presented as magenta crosses (Dunham et al. 2015). Ophiuchus is a good representative of nearby star-forming clouds, while Cepheus I presents an extreme case with very low SFR. Right: N-PDFs of the Ophiuchus and Cepheus I generated based on Herschel PACS and SPIRE images (black). The fittings of a lognormal component and a power-law tail are shown as an orange dashed line and a blue line. We plot the N-PDF of the pixels within the AV = 8 mag contour in this panel, which is shown in the gray-blue area.
Current usage metrics show cumulative count of Article Views (full-text article views including HTML views, PDF and ePub downloads, according to the available data) and Abstracts Views on Vision4Press platform.
Data correspond to usage on the plateform after 2015. The current usage metrics is available 48-96 hours after online publication and is updated daily on week days.
Initial download of the metrics may take a while.