Fig. 6
Download original image
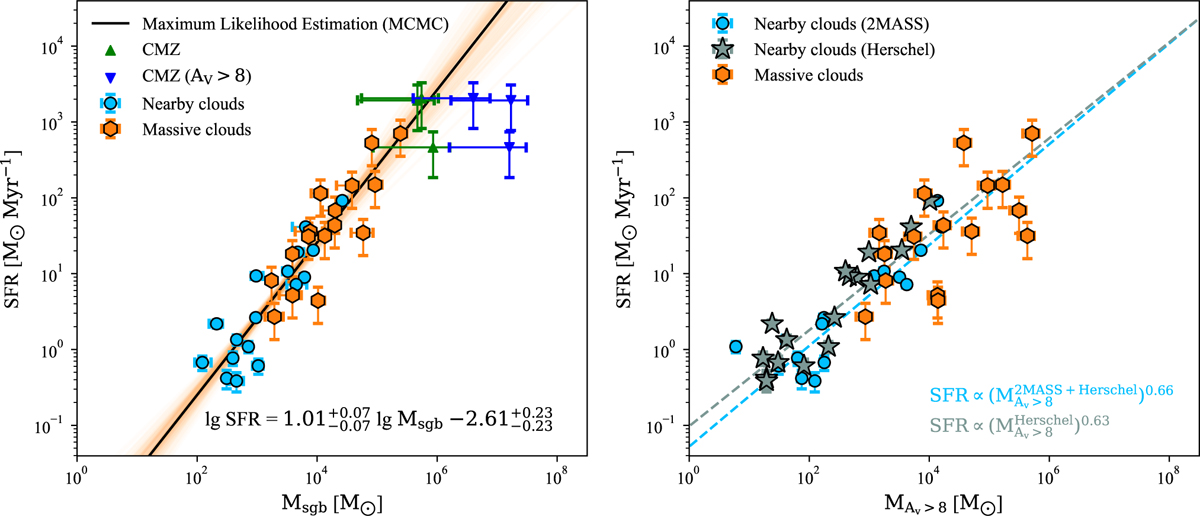
SFR vs. dense gas mass correlations. Left: correlation between the self-gravitating gas mass obtained from N-PDF and the star formation rates, for nearby and for high-mass star-forming regions. The black line is a fitting for both nearby and massive clouds, with a slope of 1.01 ± 0.07. Three regions from CMZ are marked in the plot, whose SFRs from the literature (Longmore et al. 2013), and dense gas mass calculated by the N-PDF method (green triangles) and by a fixed threshold method (blue triangles). Right: similar to the left panel, but for dense gas masses calculated by a fixed extinction or column density threshold method.
Current usage metrics show cumulative count of Article Views (full-text article views including HTML views, PDF and ePub downloads, according to the available data) and Abstracts Views on Vision4Press platform.
Data correspond to usage on the plateform after 2015. The current usage metrics is available 48-96 hours after online publication and is updated daily on week days.
Initial download of the metrics may take a while.