Open Access
Fig. 8
Download original image
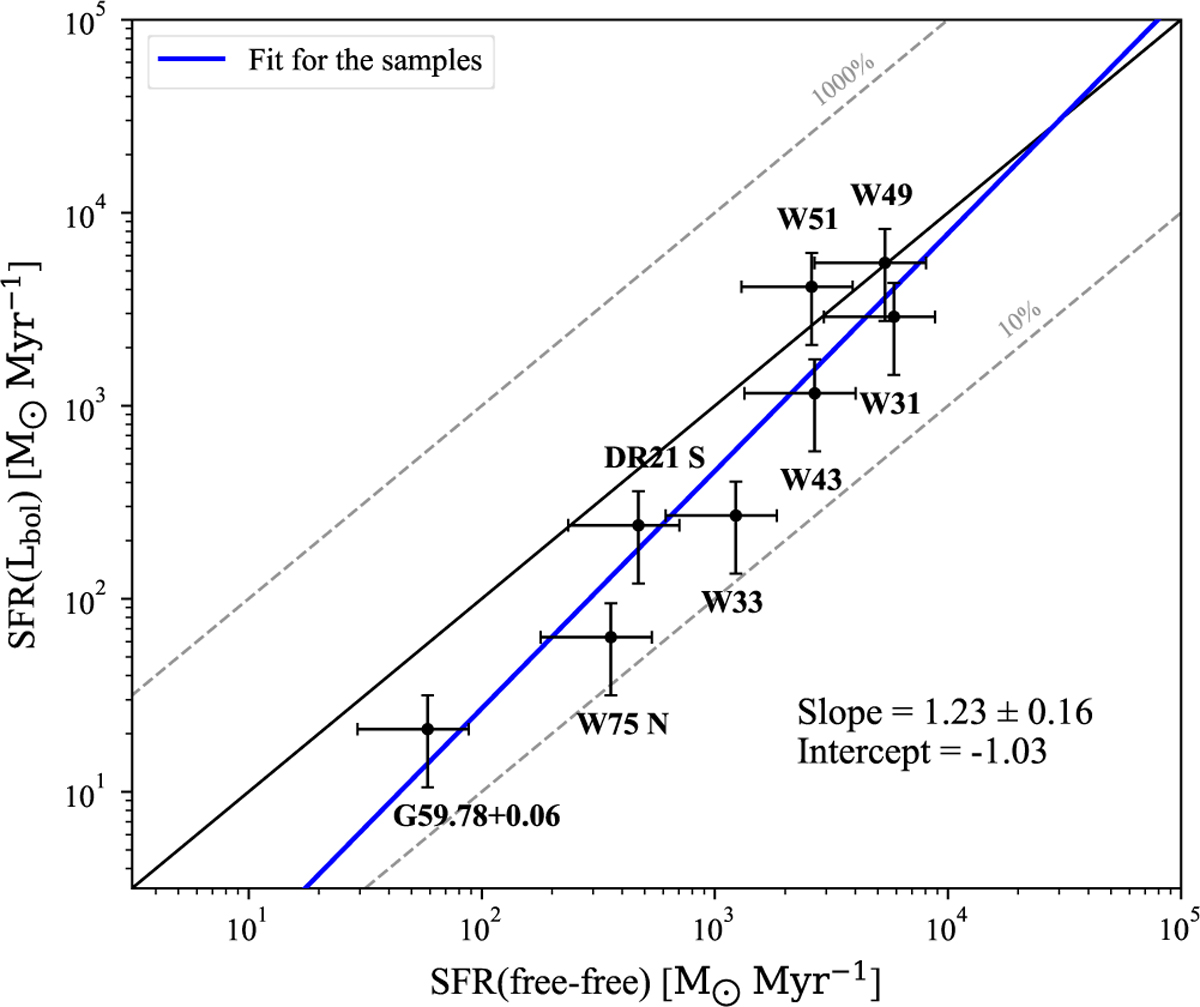
Comparison between SFR(Lbol) and SFR(free-free). The solid black line represents the 1–1 line where the two SFRs are equal. The two gray lines represent 10 and 0.1 times the SFRs from the infrared and free-free emissions, respectively. The blue line is a linear fit to the data.
Current usage metrics show cumulative count of Article Views (full-text article views including HTML views, PDF and ePub downloads, according to the available data) and Abstracts Views on Vision4Press platform.
Data correspond to usage on the plateform after 2015. The current usage metrics is available 48-96 hours after online publication and is updated daily on week days.
Initial download of the metrics may take a while.