Fig. 11
Download original image
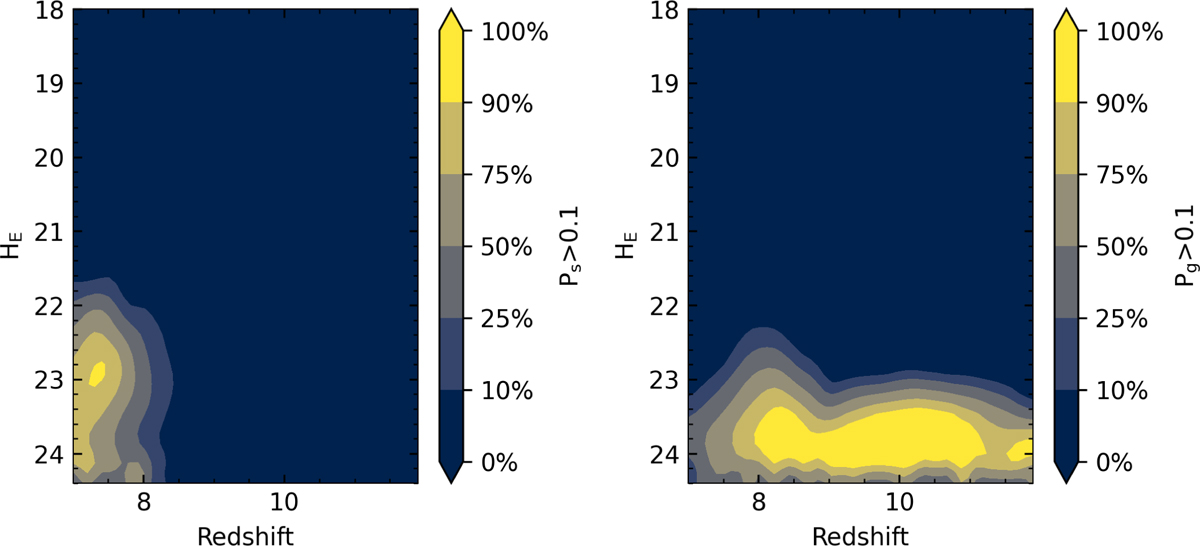
Incompleteness maps of high-z quasar selection using Owl-z, shown as a function of redshift and HE -band magnitude. Each panel displays the fraction of quasars with Pq<0.1, i.e. quasars misclassified as MLT stars (left panel) or intermediate redshift galaxies (right panel), colour-coded by the percentage of quasars lost in the bin. These maps illustrate the regions of the parameter space where the selection is least complete and help characterise the dominant sources of contamination.
Current usage metrics show cumulative count of Article Views (full-text article views including HTML views, PDF and ePub downloads, according to the available data) and Abstracts Views on Vision4Press platform.
Data correspond to usage on the plateform after 2015. The current usage metrics is available 48-96 hours after online publication and is updated daily on week days.
Initial download of the metrics may take a while.