Fig. 9
Download original image
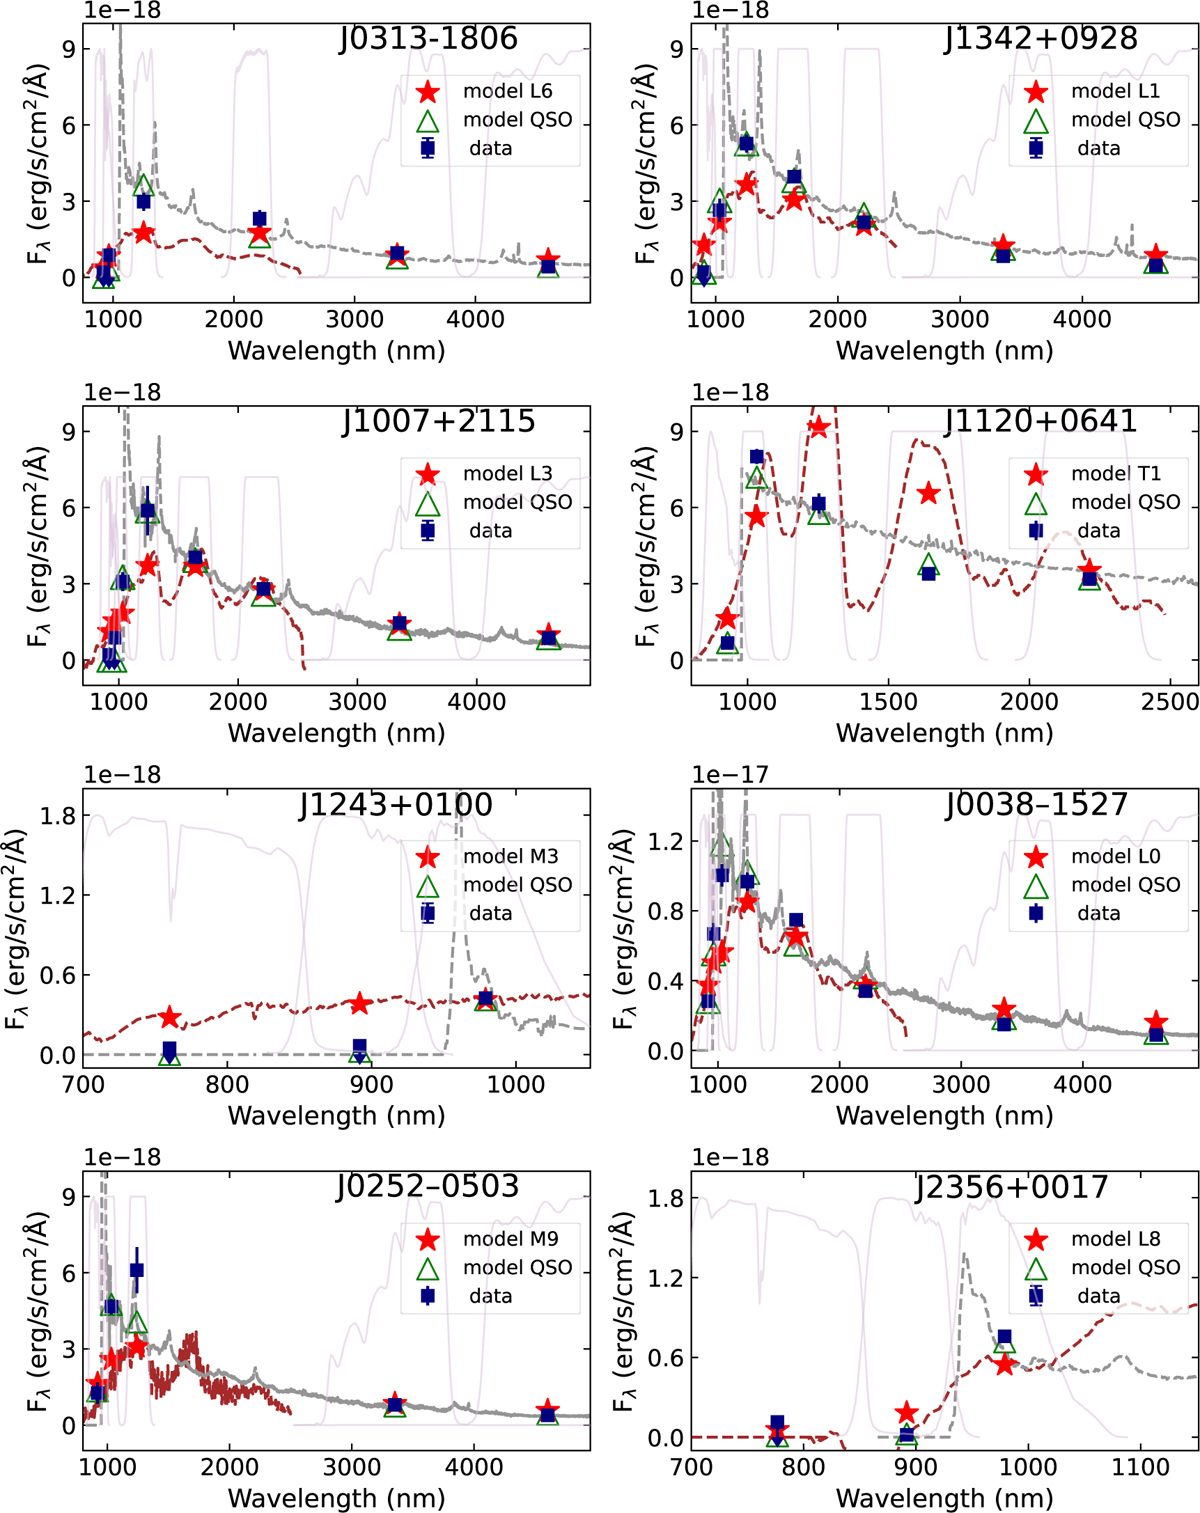
Photometric data for the eight spectroscopically confirmed quasars at z > 7 and the Owl-z best-fit solutions for quasars and MLT dwarfs. The original photometric data points are represented by blue squares. The best-fit quasar model is in dashed grey, the best-fit model for an MLT dwarf is in dashed brown, and the filter transmission curves are shown in solid light purple. Model photometry for best-fit solutions is represented by green triangles for quasars and red stars for MLT dwarfs.
Current usage metrics show cumulative count of Article Views (full-text article views including HTML views, PDF and ePub downloads, according to the available data) and Abstracts Views on Vision4Press platform.
Data correspond to usage on the plateform after 2015. The current usage metrics is available 48-96 hours after online publication and is updated daily on week days.
Initial download of the metrics may take a while.