Open Access
Fig. 6.
Download original image
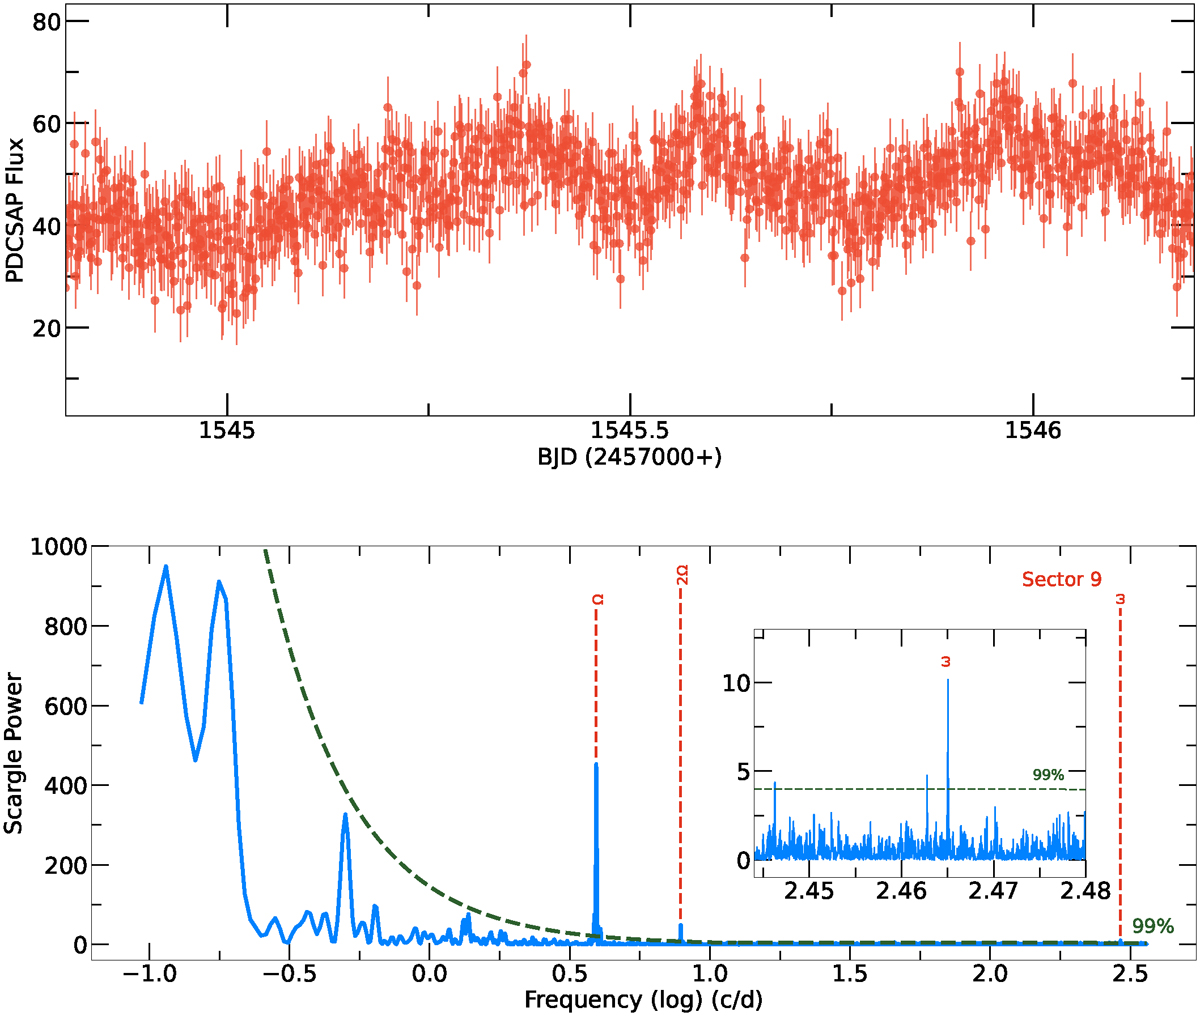
(a) TESS light curve of approximately two consecutive days for J0958 from the observation of sector 9. (b) TESS power spectra of J0958 for sector 9, with identified frequencies marked. The horizontal dashed green lines represent the 99% confidence level. The ω frequency is shown in the zoomed-in plot.
Current usage metrics show cumulative count of Article Views (full-text article views including HTML views, PDF and ePub downloads, according to the available data) and Abstracts Views on Vision4Press platform.
Data correspond to usage on the plateform after 2015. The current usage metrics is available 48-96 hours after online publication and is updated daily on week days.
Initial download of the metrics may take a while.