| Issue |
A&A
Volume 701, September 2025
|
|
|---|---|---|
| Article Number | A279 | |
| Number of page(s) | 9 | |
| Section | Stellar structure and evolution | |
| DOI | https://doi.org/10.1051/0004-6361/202553659 | |
| Published online | 24 September 2025 | |
Precise timing analysis of four magnetic cataclysmic variables with TESS
1
Aryabhatta Research Institute of Observational Sciences, Manora Peak, Nainital 263001, India
2
Mahatma Jyotiba Phule Rohilkhand University, Bareilly 243006, India
3
South African Astronomical Observatory, PO Box 9 Observatory, 7935 Cape Town, South Africa
4
Institute of Astrophysics, Pontificia Universidad Católica de Chile, Av. Vicuña MacKenna 4860, 7820436 Santiago, Chile
5
Department of Applied Physics/Physics, Bareilly College Bareilly-243001, India
⋆ Corresponding author: This email address is being protected from spambots. You need JavaScript enabled to view it.
Received:
1
January
2025
Accepted:
26
May
2025
Abstract
We analysed high time-resolution optical photometric data from the Transiting Exoplanet Survey Satellite (TESS) to study the timing behaviour of four intermediate polar-like objects: namely, V1460 Her, 1RXS J045707.4+452751, Swift J0958.0-4208, and V842 Cen. In the case of V1460 Her, we refined the measurement of its orbital period. Long-term observations suggest a gradual decrease in the orbital period of V1460 Her, and the stable light curve during the TESS observations indicates its quiescent state. We detect a beat period of 1290.6 ± 0.5 s for the first time for the source 1RXS J045707.4+452751, suggesting a possible disc-overflow accretion scenario. For the sources Swift J0958.0-4208 and V842 Cen, we determine periods of 6.11 ± 0.02 h and 3.555 ± 0.005 h, respectively, which can be provisionally suggested to be orbital periods. These findings provide valuable insights into the accretion processes and long-term evolution of these intriguing binary systems.
Key words: binaries: general / novae / cataclysmic variables / white dwarfs
© The Authors 2025
 Open Access article, published by EDP Sciences, under the terms of the Creative Commons Attribution License (https://creativecommons.org/licenses/by/4.0), which permits unrestricted use, distribution, and reproduction in any medium, provided the original work is properly cited.
This article is published in open access under the Subscribe to Open model. This email address is being protected from spambots. You need JavaScript enabled to view it. to support open access publication.
1. Introduction
Cataclysmic variables (CVs) are semi-detected interacting binary systems characterised by the dynamic interaction between a white dwarf (WD), referred to as the primary, and a late-type main-sequence star, known as the secondary. The secondary overflows its Roche lobe, leading to material accretion onto the WD (Warner 1995). These systems are categorised into two distinct groups based on the strength of the WD’s magnetic field: non-magnetic CVs (NMCVs) and magnetic CVs (MCVs). The NMCVs are characterised by their relatively weak magnetic fields, typically measuring less than 0.1 million gauss (MG), resulting in minimal influence of the magnetic field on the accretion process from the secondary star to the WD. In contrast to NMCVs, MCVs are characterised by significantly stronger magnetic fields and have two subclasses: polars and intermediate polars (IPs). Polars are unique for their exceptionally powerful magnetic fields, exceeding 10 MG (Cropper 1990). By contrast, IPs exhibit magnetic field strengths typically ranging from 1 to 10 MG (Patterson 1994).
In NMCVs, the material transferred from the secondary forms a disc around the WD and then falls onto its surface. In polars, the strong magnetic field inhibits the formation of the disc altogether, and the material is directly channelled to the poles of the WD. In addition to the magnetic field, other factors, such as the mass accretion rate and binary separation, play important roles in governing the accretion mechanism in IPs. Three distinct accretion mechanisms, namely disc-fed, stream-fed, and disc-overflow, are generally observed in IPs. In the disc-fed mechanism, the accretion proceeds via a Keplerian disc, which isdisrupted at a specific point known as the magnetospheric radius of the WD; the material then follows along the magnetic field lines (e.g. Hellier et al. 1989a). Within the stream-fed mechanism, the material is directly accreted onto the surface of the WD by following the magnetic field lines (Rosen et al. 1988). However, in the disc-overflow mechanism, material overflows from the accretion disc and collides with the magnetosphere. Consequently, the two modes of accretion, stream-fed and disc-fed, operate concurrently as described in Hellier et al. (1989b). The power at the spin (ω) and the beat (ω − Ω) frequencies in the power spectra gives us an idea about the probable accretion geometry of the system (Hellier 1991, 1993). Near the WD surface, the matter falls freely onto the surface and approaches supersonic velocities, which causes shocks to form above the WD surface. The material decelerates before settling onto the surface and emits cyclotron (optical/infrared) and bremsstrahlung (X-ray) radiation (Aizu 1973). The optical emission range is generated from the reprocessing of the X-rays from different regions of the WD, such as the surface of the WD or the accretion disc surrounding it.
In this study, we performed a detailed timing analysis of four IP-like sources using the short-cadence long-baseline TESS observations. These sources are V1460 Her, 1RXS J045707.4+452751, Swift J0958.0-4208, and V842 Cen. We were interested in finding new periods in these sources and also confirming the periods obtained from earlier studies. These periods are essential for confirming the nature of these sources and their accretion geometry. A review of each source is given in the following paragraphs.
V1460 Her was initially identified as a contact W UMa eclipsing binary (Pollacco et al. 2006) with a period of 0.208 d (Lohr et al. 2013) and an overluminous K5-type donor star. However, Drake et al. (2016) reported an outburst and suggested it as an unusual CV. Based on spectroscopic observations, Scaringi et al. (2016) found dwarf-nova outbursts in this system. Kjurkchieva et al. (2017) derived an orbital inclination of 88° ±3° for V1460 Her. It was confirmed as an IP after identifying a spin period of the WD (Pω) of 38.875 s (Ashley et al. 2020; Pelisoli et al. 2021).
1RXS J045707.4+452751 (hereafter, J045707) was identified as an X-ray source by Kaplan et al. (2006) using Chandra observations. It was first classified as an NMCV (Masetti et al. 2010), but later, from optical spectra, it was proposed to be an MCV or a high-accretion-rate nova-like source (Masetti et al. 2012). Thorstensen & Halpern (2013) detected a Pω of 1218.7 ± 0.5 s and classified it as an MCV. They also obtained a probable orbital period (PΩ) of either 4.8 h or 6.2 h using optical spectroscopy observations. Using X-ray data from XMM-Newton, Bernardini et al. (2015) determined the Pω to be 1222.6 ± 2.7 s and the mass of the WD (MWD) to be 1.12 ± 0.06 M⊙. Later, Suleimanov et al. (2019) estimated the mass of the WD to be 0.87 ± 0.14 M⊙. Using TESS data, Bruch (2024) recently derived an orbital period of 6.091 ± 0.007 h.
Swift J0958.8-4280 (hereafter, J0958) was identified as an MCV by Masetti et al. (2013) from INTEGRAL observations. Bernardini et al. (2017) determined a Pω of 296.22 ± 0.05 s using X-ray data from XMM-Newton. They recommended further observations for further classification.
V842 Cen (=Nova Centauri 1986) was discovered by McNaught & Mattei (1986) on November 22.7 UT when it was in a nova state. It took 48 d to decline its brightness by 3 mag, which suggests that it was a moderately fast nova (Sekiguchi et al. 1989). High-speed photometry by Woudt & Warner (2003) showed that the system was still active and continuously flaring on timescales of 5 min but showed no orbital modulation. Hence, they concluded that the system was seen at a low inclination. However, Woudt et al. (2009) conducted optical photometry observations in 2008 and obtained a pulsation period of 56.825 s, which they attributed to the Pω of the WD. Based on the presence of sidebands, they inferred an PΩ of 3.94 h and classified it as an IP. Luna et al. (2012) detected a period of 3.51 h, but they could not detect the 56.825 s periodicity using X-ray data from XMM-Newton. An optical light curve analysis by Sion et al. (2013) revealed a 56.5 s periodicity, which was not detected in the UV light curve constructed from Hubble Space Telescope COS spectroscopic observations. Later, Warner & Woudt (2015) suggested a period of 113.6 s, which is twice the Pω observed earlier.
The paper is organised as follows: In Sect. 2, we describe the observations and data. Section 3 contains the analysis and results. Finally, we present the discussion and conclusions in Sects. 4 and 5, respectively.
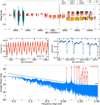 |
Fig. 1. (a) Long-term light curve of V1460 Her (see text for details). (b) TESS light curve for approximately two consecutive days of observations of V1460 Her in sector 24. (c) AAVSO-CV light curve of V1460 Her for three consecutive days. (d) Power spectra of combined TESS data for V1460 Her, where the identified frequencies are marked with vertical dashed red lines. The dashed green line represents the 99% confidence level. |
2. Observations and data
We obtained the data from high-cadence long-baseline TESS observations. The TESS (Ricker et al. 2015) instrument consists of four wide-field CCD (Charge Coupled Device) cameras that can image a region of the sky measuring 24° ×96°. The TESS observations are broken up into sectors, each lasting two orbits, or about 27.4 days, and conducts its downlink of data while at perigee. This results in a small gap in the data compared to the overall run length. The TESS bandpass extends from 600 nm to 1000 nm with an effective wavelength of 800 nm. The data for our sources are stored in the Mikulski Archive for Space Telescopes data1 with unique identification numbers ‘TIC 193515431’, ‘TIC 65820714’, ‘TIC 35975843’, and ‘TIC 411603422’ for V1460 Her, J045707, J0958, and V842 Cen, respectively. We used the pre-search data conditioned simple aperture photometry (PDCSAP) flux, which consists of simple aperture photometry (SAP) flux values corrected for instrumental variations2. The PDCSAP flux also corrects for flux captured from nearby stars. The data taken during an anomalous event had quality flags greater than zero in the fits file. We considered only PDCSAP flux data with a quality flag of zero. The log of observations is shown in Table 1. The cadence for each source was 120 s; however, 20 s cadence data were also available for V842 Cen. For V1460 Her, we also used data from the Wide Angle Search for Planets (SuperWASP; Pollacco et al. 2006), the All Sky Automated Survey for Supernovae (ASAS-SN; Shappee et al. 2014; Hart et al. 2023), the Catalina Real-Time Transient Survey (CRTS; Drake et al. 2009), the American Association of Variable Star Observers (AAVSO), and Zwicky Transient Facility (ZTF; Bellm et al. 2019).
Observation log of V1460 Her, J045707, J0958, and V842 Cen.
3. Analysis and results
3.1. V1460 Her
3.1.1. Light curves and power spectra
The long-term light curve of V1460 Her, as observed from SuperWASP, ASAS-SN, CRTS, AAVSO, and ZTF, is shown in Fig. 1a. Timings of the TESS observations are shown by a shaded grey region. V1460 Her was observed in seven sectors by TESS (see Table 1). Figure 1b shows the TESS light curve of V1460 Her for sector 24 for approximately two consecutive days. The eclipsing nature of the light curves is clearly evident, with two eclipse-like profiles. The deeper dip in the flux was considered the primary eclipse, whereas the shallower dip was considered the secondary eclipse. The time series data from all seven sectors were separately analysed using the Lomb-Scargle (LS) periodogram (Lomb 1976; Scargle 1982) method to determine the periodic behaviour of the light curve. The LS power spectral analysis was also performed on all the sectors’ combined datasets. Figure 1d shows the power spectra of the combined dataset. The lower frequency limit was set to the 2/timespan of the observations. The significance of peaks in power spectra was evaluated using the technique described by Vaughan (2005). Considering the impact of pink, white, and blue noise on the TESS power spectra (Kálmán et al. 2025), we account for these different noise components in our data. Since the data do not exhibit high-frequency noise, we exclude the blue noise component from our analysis. We detect only the significant orbital frequency (Ω) and its harmonics (marked in dashed red lines in Fig. 1d), which lie above the 99% confidence level in the combined dataset and also in all the individual sectors. The 2Ω frequency is the most dominant frequency in the power spectra. In Table 2, we provide the values of the derived PΩ in the individual sectors. The previously reported Pω of 38.875 s by Ashley et al. (2020) exceeds the Nyquist limit of ∼360 cycle d−1 (c/d) for the current data; therefore, we are not able to detect the Pω.
Periods obtained corresponding to the dominant peaks of the LS power spectra of V1460 Her, J045707, J0958, and V842 Cen.
3.1.2. Ephemeris and O-C analysis
We calculated eclipse midpoints by fitting the eclipses (both the primary and secondary eclipses) with a constant plus a Gaussian. The time at which we obtained the first primary eclipse of the TESS light curve was taken as the starting point of the orbital cycle. A total of 39 timings of minima from AAVSO and 1377 from TESS were extracted. The data from CRTS, ASAS-SN, and ZTF were sparse, so we could not determine the exact minima from these light curves. These minimum timings are plotted against the cycle numbers. A linear fit between the cycle numbers and minima timings provides the following ephemeris:
 (1)
(1)
The numbers in parentheses represent the errors on the corresponding parameters. We determine a refined orbital period of V1460 Her to be 4.98845829 ± 0.00000009 h. We also calculated the ephemeris after excluding the AAVSO data and found that the orbital period remains relatively consistent, with a difference of about 0.024 s; incorporating the AAVSO data yields a more precise ephemeris. Furthermore, folding the light curve with the derived ephemeris after excluding the AAVSO data does not alter our analysis. The difference between observed and calculated (O-C) eclipse timings is shown in Fig. 2, where a noticeable pattern is visible. By fitting a parabola between O-C and cycle numbers, the rate of change in the PΩ is estimated as −(3.9 ± 0.2)×10−10 ss−1. The negative sign indicates that the PΩ decreases over time.
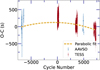 |
Fig. 2. O-C diagram for V1460 Her. |
3.1.3. Phase folded light curves
The day-wise evolution of the orbital phased light curve for the TESS data was also investigated and is shown in Fig. 3a. The white spaces in Fig. 3a show the gap in the data. The light curve was folded using the ephemeris as given in Eq. (1). Throughout all the sectors, we observe two maxima at phases 0.25 and 0.75. We do not find any significant change in the phases of the maxima in the day-wise folded light curves.
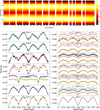 |
Fig. 3. (a) Day-wise orbital phase-folded light curve for V1460 Her from all sectors. The colour bar on the right side indicates the normalised flux. (b) Orbital phase-folded light curves for V1460 Her observed using the SuperWASP, CTRS, ASAS-SN, AAVSO, TESS, and ZTF facilities at different epochs. The colour schemes of the light curve are similar to that in Fig. 1a. The epochs (in the year) are shown at the top of each panel. The phase bin size was chosen as 0.01. |
We also compared the average phase-folded light curves from different epochs of observations for V1460 Her, which are shown in Fig. 3b. All the light curves were folded using the ephemeris, as given in Eq. (1). As previously noted by Kjurkchieva et al. (2017), we also found a different nature of the phased light curve for epoch 2016.4, which may be in the outburst state, as reported by Drake et al. (2016). The folded light curve pattern is observed to be distinct in both quiescent and outburst states. The quiescent profile exhibits double-peaked orbital modulations, with maxima occurring near phases 0.75 and 0.25, and with shallow and deeper minima at phases 0.50 and 0, respectively. The two peaks appear to be of similar amplitude in some epochs; however, in most epochs, they are of unequal amplitude. The presence of a double-humped feature is also evident from the power spectrum, where a strong significant peak corresponds to the second harmonic of the orbital frequency. However, during the outburst at epoch 2016.4, a broader minimum appears, filled with emission and exhibiting stablebrightness.
3.2. J045707
3.2.1. Light curves and power spectra
Figure 4a displays the light curve for J045707 for approximately one orbital cycle, whereas Fig. 4b shows the LS power spectrum obtained for the entire light curve. The significance level was calculated following the same methodology as applied to the previous source. Three dominant frequencies were clearly identified above the 99% confidence limit. The most dominant peak in the power spectrum was found at 1218.7 s, corresponding to the Pω. The second most dominant peak was found at 6.09 h, corresponding to the PΩ of the system. Using the values of the Pω and the PΩ, we derived the beat period (Pω − Ω) of the system to be ∼1290.4 s, which is clearly evident in the power spectra as a period of 1290.5 s. All the significant periods derived from power spectra are given in Table 2.
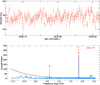 |
Fig. 4. (a) TESS light curve of approximately one orbital cycle for J045707 from the observation of sector 59. (b) TESS power spectra for J045707 from sector 59, with the identified frequencies marked. The horizontal dashed green lines represent the 99% confidence level. The ω − Ω frequency is shown in the zoomed-in plot. |
3.2.2. Phase folded light curves
We folded the whole sector’s light curve using the ephemeris BJD = 2459991.6626 + 0.253875 E. Figure 5a shows the orbital phase-folded light curve of J045707, which confirms the derived orbital period. We also folded the data using the previously suggested orbital periods of 4.8 and 6.2 h from Thorstensen & Halpern (2013), but found no regular pattern in the phased light curve. We also folded the entire sector’s light curve with the Pω shown in Fig. 5b. The spin-phased light curve exhibits a single-peaked pulse profile. To observe the evolution of the spin pulse profile, we folded each day’s light curves over our derived Pω, using the first observation time (BJD = 2459911.44) as the reference epoch. The day-wise evolution of the spin pulse profile is shown in Fig. 5c. This also shows only one peak throughout theobservations.
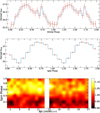 |
Fig. 5. (a) Orbital and (b) Spin phase-folded light curve for J045707 with a binning of 20. (c) Day-wise spin phase-folded light curve for J045707 with a bin size of 0.05. The colour bar represents the normalised flux. |
3.3. J0958
3.3.1. Light curves and power spectra
J0958 was observed in only one sector of the TESS observations, and the light curve for approximately two consecutive days is shown in Fig. 6a. Similar to the previous two sources, the LS periodogram was performed to find the underlying periodicities. The power spectra is shown in Fig. 6b. We predominantly obtain three frequencies at 3.93, 7.85, and 291.77 c/d, which lie above the 99% confidence limit. The most dominant frequency at 3.93 c/d corresponds to the period of 6.11 h, which we identify as PΩ of the system. The subsequent dominant frequency corresponds to the harmonic of the orbital period. A peak is also found at 296.12 s, similar to that obtained in earlier studies as the Pω of the WD. This is shown in the zoomed-in plot of Fig. 6b. The orbital and spin periods are listed in Table 2.
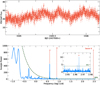 |
Fig. 6. (a) TESS light curve of approximately two consecutive days for J0958 from the observation of sector 9. (b) TESS power spectra of J0958 for sector 9, with identified frequencies marked. The horizontal dashed green lines represent the 99% confidence level. The ω frequency is shown in the zoomed-in plot. |
3.3.2. Phase folded light curves
We also folded the entire light curve with a period of 6.11 h to confirm the presence of the PΩ. The phase-folded light curve is shown in Fig. 7a. The nature of the folded light curve confirms that this period is indeed the true PΩ of the system. Similarly, the entire sector’s light curve was also folded across the obtained Pω; the corresponding spin phase-folded light curve is shown in Fig. 7b. The spin-folded light curve exhibits two peaks of unequal intensity, with the secondary peak only marginally exceeding the minimum flux. We also performed day-wise evolution of spin pulse, but did not find any periodic pattern in the phased light curve.
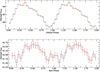 |
Fig. 7. (a) Orbital and (b) Spin phase-folded light curve for J0958 with a binning of 20. |
3.4. V842 Cen
3.4.1. Light curves and power spectra
V842 Cen was observed in sector 38 during the TESS observations. Both 120 and 20 s cadence data were available, and the light curve of approximately 4 h for the 20 s cadence data is shown in Fig. 8a. The LS periodogram analysis was performed on both 120 and 20 s cadence datasets, and the power spectra corresponding to the 20 s cadence data is shown in Fig. 8b. The frequencies 6.751 and 0.431 c/d with corresponding periods of 3.555 h and 2.32 d, respectively, were found above the 99% confidence level in the power spectra of 20 s cadence data. However, only the period 3.555 h was found to be consistent in the power spectra of 20 and 120 s cadences’ light curves. Therefore, we have not considered the lower frequency for further analysis.
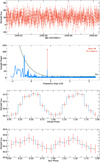 |
Fig. 8. (a) TESS light curve for approximately 4 h of V842 Cen from the observation of 20 s cadence data in sector 38. (b) TESS power spectra of V842 Cen from 20 s cadence data in sector 38, with the identified frequency marked by a dashed red line. The horizontal dashed green line represents the 99% confidence level. (c) and (d) Folded light curves of V842 Cen over periods of 3.555 h and 56.5 s, respectively, with a phase bin of 0.1. |
The previously reported Pω of 56.825/56.5/113.6 s lay beyond the Nyquist limit of the 120 s cadence data but were within the Nyquist limit for the 20 s cadence data. However, no peak corresponding to these frequencies was observed.
3.4.2. Phase folded light curves
We folded the 20 s cadence light curve on the period of 3.555 h obtained from the power spectral analysis; it is shown in Fig. 8c. A pattern similar to that plotted was also found for the 120 s cadence data, confirming the presence of 3.555 h periodicity; thus, it could be the probable PΩ of V842 Cen. We also folded the light curve with the previously inferred PΩ from Woudt et al. (2009), but found no periodic pattern at these periods. We searched for spin modulations in the TESS light curve by folding the data at three previously reported periods: 56.5 s, 56.825 s, and 113.6 s. While folding at 56.825 s and 113.6 s revealed no discernible periodic patterns, a clear periodic signal was seen when using the 56.5 s period. Figure 8d shows the folded light curve on the period of 56.5 s. For the folding of the light curve, we used the ephemeris provided by Warner & Woudt (2015).
4. Discussion
We carried out a detailed timing analysis of two IPs and two IP candidates using the long time-series high-cadence optical photometric TESS observations. Here, we discuss the results obtained for each individual source.
4.1. V1460 Her
The orbital period of V1460 Her is derived to be 4.98845829 ± 0.00000009 h, which is more precise than that reported in previous studies. Based on the O-C analysis, we observe that the orbital period decreases at a rate of 1.23 seconds per century. This gradual decrease in the orbital period could be due to the angular momentum loss, which reduces the separation between the primary and secondary, resulting in a decrease in the orbital period. With a period above the period gap (≥3 h), the dominant angular momentum loss mechanism occurs through magnetic braking (e.g. see Rappaport et al. 1983; Schreiber et al. 2010).
The presence of double-humped light curve features and the detection of the dominant power at 2Ω in V1460 Her suggest that these variations result from the ellipsoidal modulation of the secondary (Warner 1995). The two maxima in the light curves are the result of maximum visibility in the deformed sides of the secondary at orbital phases ∼0.75 and ∼0.25. At the deeper minimum phase during quiescence, the most probable cause of obscuration between the observer and the combined light of the secondary is a faint accretion disc. This deeper minimum phase, filled with emission during the outburst and the flat out-of-eclipse feature, suggests that the accretion disc dominates the light, and the contribution from the secondary star becomes negligible or less visible compared to quiescence. The double-peaked light curve feature was also observed by Zola et al. (2017) and Kjurkchieva et al. (2017). Throughout the entire duration of the TESS observations, the light curve is found to be fairly stable, suggesting that the system is presently in a quiescent state.
Furthermore, after carefully inspecting both maxima of the phased light curves, we find that in some epochs, the maxima at 0.25 phase are less bright than the ones at 0.75 phase. In some epochs, a reverse trend is seen. This asymmetrical nature of the maxima can be explained by the presence of magnetic activities in the secondary, often known as the O’Connell effect (O’Connell 1951). A similar result was also noticed by Qian et al. (2017).
4.2. J045707
The periodogram analysis of J045707 clearly reveals a dominant period of 6.093 ± 0.002 h, which we suggest is the probable PΩ of the system. Thorstensen & Halpern (2013) suggested a possible PΩ of either 4.8 or 6.2 h for this system. We show that a period of 6.093 h folds the data better than other orbital periods suggested in previous studies. Thus, we confirm that the PΩ of this system is 6.093 h, which agrees with the period obtained by Bruch (2024). We also find a Pω of 1218.7 ± 0.5 s for the WD, similar to that found by Thorstensen & Halpern (2013). Based on our derived values of PΩ and Pω, the Pω − Ω is estimated to be ∼1290 s, which is also detected in the power spectrum. This is the first detection of a significant ω − Ω frequency for J045707, enabled by the improved time cadence and longer baseline of theTESS.
The detection of a beat modulation in J045707 cannot be attributed to the amplitude modulation of the ω at the Ω. If it were caused by orbital modulation at the ω frequency, both the ω − Ω and ω + Ω frequencies should be present in the power spectrum with equal power (Warner 1986), which is contrary to what is observed in the present dataset. Thus, the detection of ω − Ω seems intrinsic.
J045707 has a slow spinning WD (1218.7 s), and the spin-to-orbital period ratio is determined to be 0.056. Such systems are expected to be disc-fed, but the presence of the ω − Ω frequency also suggests the possibility of a disc-overflow system. However, X-ray detection of the ω − Ω frequency is required to confirm the accretion geometry, as the ω − Ω in the optical band may also arise from a spin-varying X-ray beam illuminating such structures as the secondary star or the hotspot, which are fixed in the orbital frame. In the case of stream-fed accretion, Ferrario & Wickramasinghe (1999) suggested that significant power in the ω − Ω frequency can be detected in the optical band if the up (above the orbital plane) and down (below the orbital plane) field symmetry is broken. As J045707 is a relatively slow rotator, it must have a strong magnetic field (Allan et al. 1996).
4.3. J0958
For the first time, we find clear evidence of a PΩ of 6.11 h. Bernardini et al. (2017) proposed that this source exhibits long-term X-ray variability on a timescale of approximately 8 h. However, our results indicate a shorter PΩ. Additionally, we explored the potential variability around 2.2 h, as mentioned by Bernardini et al. (2017), but found no evidence for this in the TESS dataset. We also obtained a Pω of 296.12 s, which is almost consistent with the results obtained by Bernardini et al. (2017).
From the obtained values of the PΩ and the Pω, the Pω − Ω of the system is estimated to be 300.16 s. However, we did not get any peak around this value in the power spectra. This suggests the system to be a disc-fed accretor. The value of the spin-to-orbital period is derived to be 0.013 (≤0.1). This low value also favours disc-fed accretion. Contrary to J045707, the source J0958 is a fast rotator (296.12 s). Hence, it must have a weak magnetic field.
4.4. V842 Cen
We detect a period of 3.555 h in this system. Previously, Woudt et al. (2009) inferred the PΩ to be 3.94 h from the values obtained for the Pω and other sidebands, which we could not detect in the TESS observations. However, our derived period is consistent with the orbital period reported by Luna et al. (2012) using X-ray data. Again, the inferred PΩ of 3.94 h may not be the orbital period of the system, when considering the WD Pω of 113.6 s as proposed by Warner & Woudt (2015). Thus, a period of 3.555 h appears to be the orbital period of V842 Cen. Contrary to earlier findings, the TESS power spectrum showed no periodic signals at the previously identified spin frequencies. Additionally, past investigations with ROSAT, XMM-Newton, and Swift X-ray observations yielded no detection of pulsed emission (Pω). The folded light curve, exhibiting a 56.5 s periodicity, suggests this as a likely spin period for V842 Cen. However, further X-ray and optical observations are required to constrain theseperiodicities.
5. Conclusions
The long-term photometric TESS observations of V1460 Her, J045707, J0958, and V842 Cen lead us to the following conclusions:
-
Using the extensive TESS observations, we derive a more precise orbital period of 4.98845829 ± 0.00000009 h for V1460 Her. The long-term photometric data reveals a decreasing trend in the orbital period of V1460 Her.
-
We confirm the orbital period and, for the first time, detect a beat period of 1290.6 ± 0.5 s in the J045707 source. While the strong spin frequency suggests that disc-fed accretion is the primary mode of accretion, the detection of the beat frequency indicates that some material may be accreting directly onto the WD along its magnetic field lines.
-
The orbital period of 6.11 h for the source J0958 was determined for the first time. The present analysis indicates that J0958 is a disc-fed accreting system.
-
Present analysis suggests an orbital period of 3.555 h for the source V842 Cen. The TESS data also indicates the presence of a previously reported spin periodicity of 56.5 s. The lack of clear identification of a spin period for V842 Cen in both the current TESS observations and previous X-ray data continues to cast uncertainty on its status as an IP.
See Sect. 2.1 of the TESS archive manual at https://outerspace.stsci.edu/display/TESS/2.1+Levels+of+data+processing
Acknowledgments
We thank the referee for reading our manuscript and providing useful comments and suggestions. This paper includes data collected by the TESS mission funded by NASA’s Science Mission Directorate. We acknowledge with thanks the variable star observations from the AAVSO International Database contributed by observers worldwide and used in this research. The CRTS and ZTF surveys are supported by the U.S. National Science Foundation under grants AST-0909182/AST-1313422 and AST-1440341/AST-2034437, respectively. The superWASP data is provided by the WASP consortium and services at the NASA Exoplanet Archive, which is operated by the California Institute of Technology, under contract with the National Aeronautics and Space Administration under the Exoplanet Exploration Program.
References
- Aizu, K. 1973, Prog. Theor. Phys., 49, 1184 [CrossRef] [Google Scholar]
- Allan, A., Horne, K., Hellier, C., et al. 1996, MNRAS, 279, 1345 [NASA ADS] [CrossRef] [Google Scholar]
- Ashley, R. P., Marsh, T. R., Breedt, E., et al. 2020, MNRAS, 499, 149 [NASA ADS] [CrossRef] [Google Scholar]
- Bellm, E. C., Kulkarni, S. R., Graham, M. J., et al. 2019, PASP, 131, 018002 [Google Scholar]
- Bernardini, F., de Martino, D., Mukai, K., et al. 2015, MNRAS, 453, 3100 [Google Scholar]
- Bernardini, F., de Martino, D., Mukai, K., et al. 2017, MNRAS, 470, 4815 [NASA ADS] [CrossRef] [Google Scholar]
- Bruch, A. 2024, AJ, 168, 121 [Google Scholar]
- Cropper, M. 1990, Space Sci. Rev., 54, 195 [CrossRef] [Google Scholar]
- Drake, A. J., Djorgovski, S. G., Mahabal, A., et al. 2009, ApJ, 696, 870 [Google Scholar]
- Drake, A. J., Djorgovski, S. G., Mahabal, A. A., et al. 2016, ATel, 9319, 1 [Google Scholar]
- Ferrario, L., & Wickramasinghe, D. T. 1999, MNRAS, 309, 517 [NASA ADS] [CrossRef] [Google Scholar]
- Hart, K., Shappee, B. J., Hey, D., et al. 2023, ArXiv e-prints [arXiv:2304.03791] [Google Scholar]
- Hellier, C. 1991, MNRAS, 251, 693 [Google Scholar]
- Hellier, C. 1993, MNRAS, 265, L35 [Google Scholar]
- Hellier, C., Mason, K. O., & Cropper, M. 1989a, MNRAS, 237, 39P [Google Scholar]
- Hellier, C., Mason, K. O., Smale, A. P., et al. 1989b, MNRAS, 238, 1107 [NASA ADS] [CrossRef] [Google Scholar]
- Kálmán, S., Csizmadia, S., Pál, A., & Szabó, G. M. 2025, Res. Notes Am. Astron. Soc., 9, 33 [Google Scholar]
- Kaplan, D. L., Gaensler, B. M., Kulkarni, S. R., & Slane, P. O. 2006, ApJS, 163, 344 [Google Scholar]
- Kjurkchieva, D. P., Popov, V. A., Vasileva, D. L., & Petrov, N. I. 2017, New Astron., 52, 8 [Google Scholar]
- Lohr, M. E., Norton, A. J., Kolb, U. C., et al. 2013, A&A, 549, A86 [NASA ADS] [CrossRef] [EDP Sciences] [Google Scholar]
- Lomb, N. R. 1976, Ap&SS, 39, 447 [Google Scholar]
- Luna, G. J. M., Diaz, M. P., Brickhouse, N. S., & Moraes, M. 2012, MNRAS, 423, L75 [NASA ADS] [CrossRef] [Google Scholar]
- Masetti, N., Parisi, P., Palazzi, E., et al. 2010, A&A, 519, A96 [NASA ADS] [CrossRef] [EDP Sciences] [Google Scholar]
- Masetti, N., Parisi, P., Jiménez-Bailón, E., et al. 2012, A&A, 538, A123 [NASA ADS] [CrossRef] [EDP Sciences] [Google Scholar]
- Masetti, N., Parisi, P., Palazzi, E., et al. 2013, A&A, 556, A120 [NASA ADS] [CrossRef] [EDP Sciences] [Google Scholar]
- McNaught, R. H., & Mattei, J. A. 1986, IAU Circ., 4284, 4 [Google Scholar]
- O’Connell, D. J. K. 1951, Publ. Riverview Coll. Obs., 2, 85 [Google Scholar]
- Patterson, J. 1994, PASP, 106, 209 [Google Scholar]
- Pelisoli, I., Marsh, T. R., Ashley, R. P., et al. 2021, MNRAS, 507, 6132 [Google Scholar]
- Pollacco, D. L., Skillen, I., Collier Cameron, A., et al. 2006, PASP, 118, 1407 [NASA ADS] [CrossRef] [Google Scholar]
- Qian, S. B., Han, Z. T., Zhang, B., et al. 2017, ApJ, 848, 131 [Google Scholar]
- Rappaport, S., Verbunt, F., & Joss, P. C. 1983, ApJ, 275, 713 [Google Scholar]
- Ricker, G. R., Winn, J. N., Vanderspek, R., et al. 2015, J. Astron. Telesc. Instrum. Syst., 1, 014003 [Google Scholar]
- Rosen, S. R., Mason, K. O., & Cordova, F. A. 1988, MNRAS, 231, 549 [NASA ADS] [CrossRef] [Google Scholar]
- Scargle, J. D. 1982, ApJ, 263, 835 [Google Scholar]
- Scaringi, S., Mason, E., Van Winckel, H., & Escorza, A. 2016, ATel, 9122, 1 [Google Scholar]
- Schreiber, M. R., Gänsicke, B. T., Rebassa-Mansergas, A., et al. 2010, A&A, 513, L7 [NASA ADS] [CrossRef] [EDP Sciences] [Google Scholar]
- Sekiguchi, K., Feast, M. W., Fairall, A. P., & Winkler, H. 1989, MNRAS, 241, 311 [Google Scholar]
- Shappee, B. J., Prieto, J. L., Grupe, D., et al. 2014, ApJ, 788, 48 [Google Scholar]
- Sion, E. M., Szkody, P., Mukadam, A., et al. 2013, ApJ, 772, 116 [NASA ADS] [CrossRef] [Google Scholar]
- Suleimanov, V. F., Doroshenko, V., & Werner, K. 2019, MNRAS, 482, 3622 [NASA ADS] [CrossRef] [Google Scholar]
- Thorstensen, J. R., & Halpern, J. 2013, AJ, 146, 107 [NASA ADS] [CrossRef] [Google Scholar]
- Vaughan, S. 2005, A&A, 431, 391 [NASA ADS] [CrossRef] [EDP Sciences] [Google Scholar]
- Warner, B. 1986, MNRAS, 219, 751 [Google Scholar]
- Warner, B. 1995, Cambridge Astrophys. Ser., 28 [Google Scholar]
- Warner, B., & Woudt, P. A. 2015, Mem. Soc. Astron. It., 86, 108 [Google Scholar]
- Woudt, P. A., & Warner, B. 2003, MNRAS, 340, 1011 [NASA ADS] [CrossRef] [Google Scholar]
- Woudt, P. A., Warner, B., Osborne, J., & Page, K. 2009, MNRAS, 395, 2177 [NASA ADS] [CrossRef] [Google Scholar]
- Zola, S., Szkody, P., Ciprini, S., et al. 2017, AJ, 154, 276 [Google Scholar]
All Tables
Periods obtained corresponding to the dominant peaks of the LS power spectra of V1460 Her, J045707, J0958, and V842 Cen.
All Figures
|
Fig. 1. (a) Long-term light curve of V1460 Her (see text for details). (b) TESS light curve for approximately two consecutive days of observations of V1460 Her in sector 24. (c) AAVSO-CV light curve of V1460 Her for three consecutive days. (d) Power spectra of combined TESS data for V1460 Her, where the identified frequencies are marked with vertical dashed red lines. The dashed green line represents the 99% confidence level. |
| In the text | |
|
Fig. 2. O-C diagram for V1460 Her. |
| In the text | |
|
Fig. 3. (a) Day-wise orbital phase-folded light curve for V1460 Her from all sectors. The colour bar on the right side indicates the normalised flux. (b) Orbital phase-folded light curves for V1460 Her observed using the SuperWASP, CTRS, ASAS-SN, AAVSO, TESS, and ZTF facilities at different epochs. The colour schemes of the light curve are similar to that in Fig. 1a. The epochs (in the year) are shown at the top of each panel. The phase bin size was chosen as 0.01. |
| In the text | |
|
Fig. 4. (a) TESS light curve of approximately one orbital cycle for J045707 from the observation of sector 59. (b) TESS power spectra for J045707 from sector 59, with the identified frequencies marked. The horizontal dashed green lines represent the 99% confidence level. The ω − Ω frequency is shown in the zoomed-in plot. |
| In the text | |
|
Fig. 5. (a) Orbital and (b) Spin phase-folded light curve for J045707 with a binning of 20. (c) Day-wise spin phase-folded light curve for J045707 with a bin size of 0.05. The colour bar represents the normalised flux. |
| In the text | |
|
Fig. 6. (a) TESS light curve of approximately two consecutive days for J0958 from the observation of sector 9. (b) TESS power spectra of J0958 for sector 9, with identified frequencies marked. The horizontal dashed green lines represent the 99% confidence level. The ω frequency is shown in the zoomed-in plot. |
| In the text | |
|
Fig. 7. (a) Orbital and (b) Spin phase-folded light curve for J0958 with a binning of 20. |
| In the text | |
|
Fig. 8. (a) TESS light curve for approximately 4 h of V842 Cen from the observation of 20 s cadence data in sector 38. (b) TESS power spectra of V842 Cen from 20 s cadence data in sector 38, with the identified frequency marked by a dashed red line. The horizontal dashed green line represents the 99% confidence level. (c) and (d) Folded light curves of V842 Cen over periods of 3.555 h and 56.5 s, respectively, with a phase bin of 0.1. |
| In the text | |
Current usage metrics show cumulative count of Article Views (full-text article views including HTML views, PDF and ePub downloads, according to the available data) and Abstracts Views on Vision4Press platform.
Data correspond to usage on the plateform after 2015. The current usage metrics is available 48-96 hours after online publication and is updated daily on week days.
Initial download of the metrics may take a while.