Fig. 8.
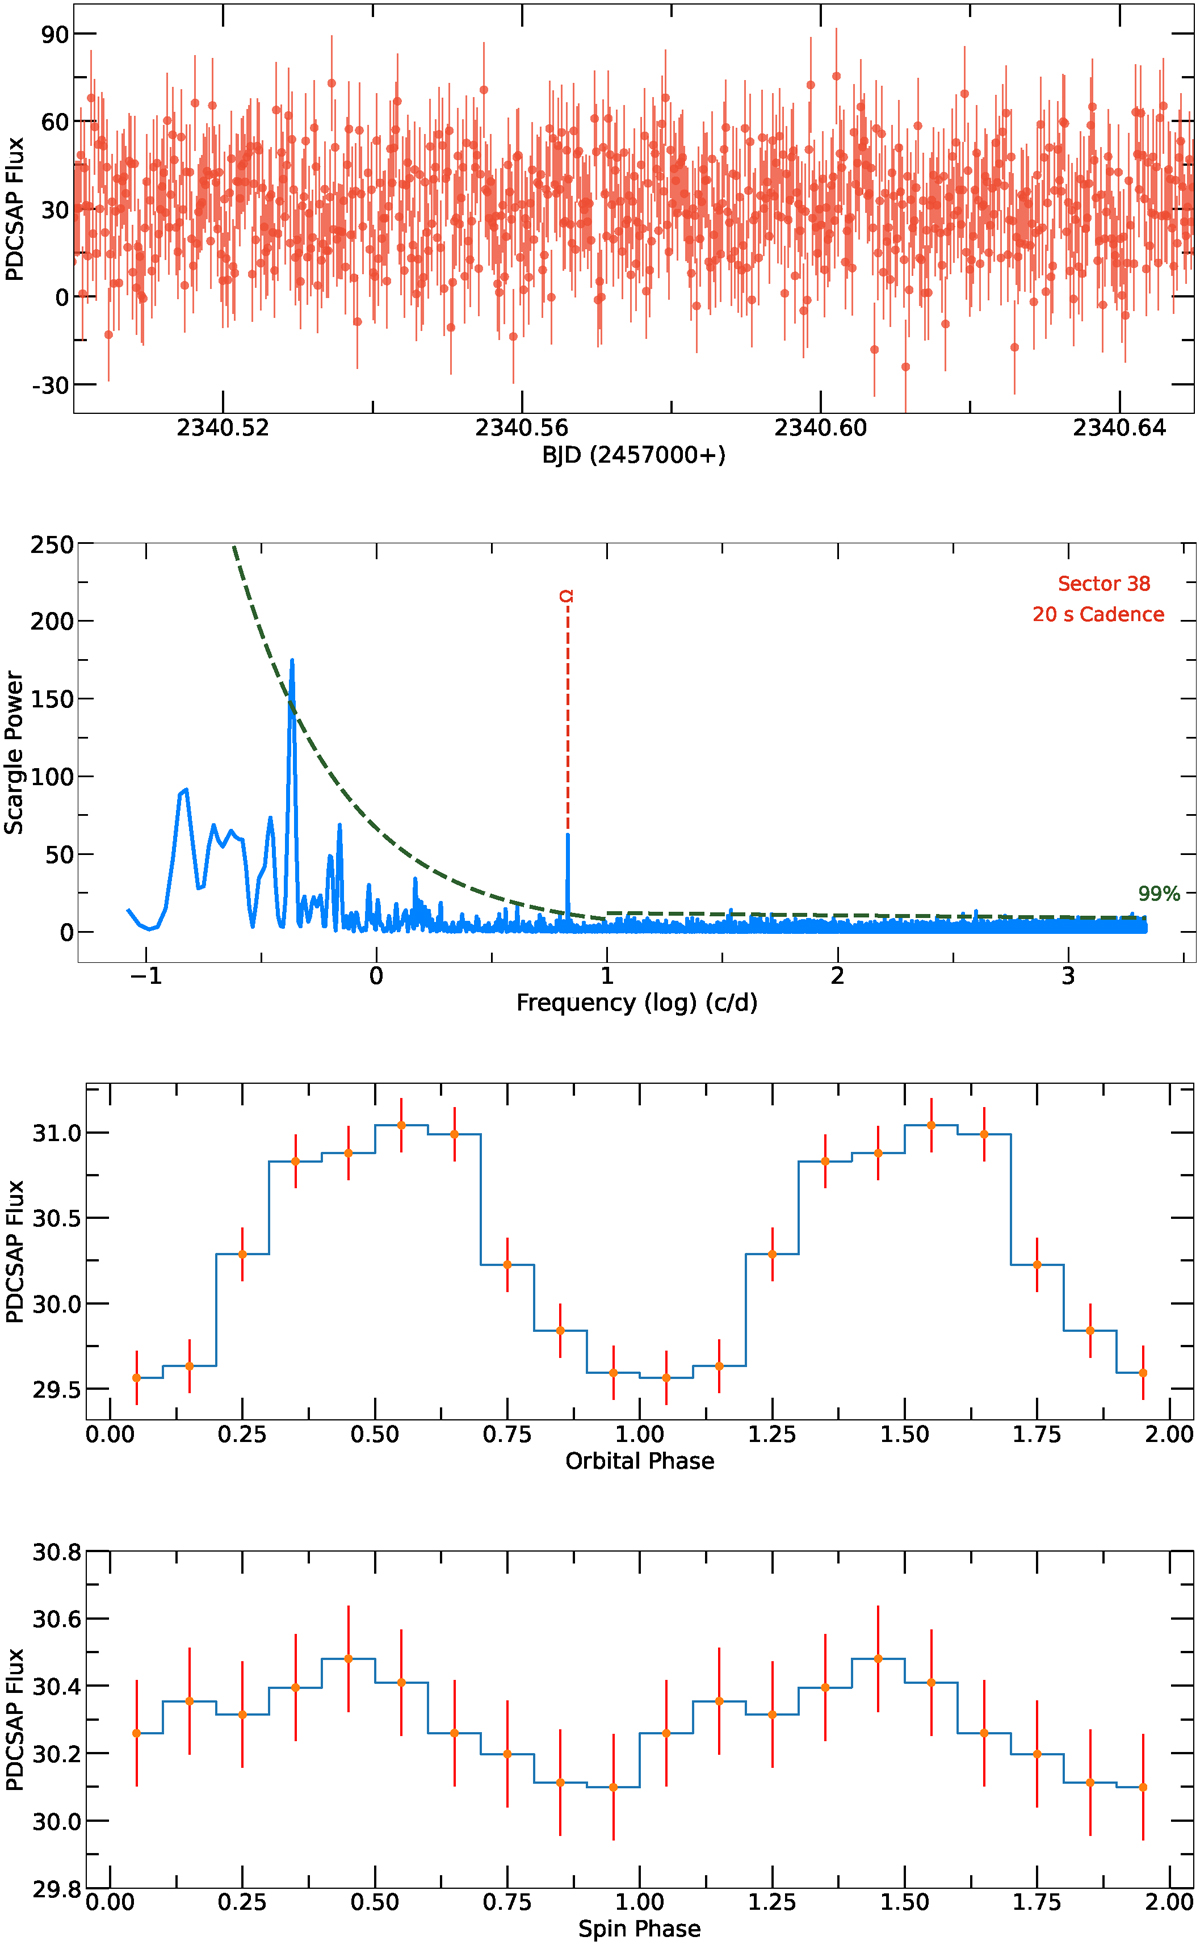
Download original image
(a) TESS light curve for approximately 4 h of V842 Cen from the observation of 20 s cadence data in sector 38. (b) TESS power spectra of V842 Cen from 20 s cadence data in sector 38, with the identified frequency marked by a dashed red line. The horizontal dashed green line represents the 99% confidence level. (c) and (d) Folded light curves of V842 Cen over periods of 3.555 h and 56.5 s, respectively, with a phase bin of 0.1.
Current usage metrics show cumulative count of Article Views (full-text article views including HTML views, PDF and ePub downloads, according to the available data) and Abstracts Views on Vision4Press platform.
Data correspond to usage on the plateform after 2015. The current usage metrics is available 48-96 hours after online publication and is updated daily on week days.
Initial download of the metrics may take a while.