Fig. 4.
Download original image
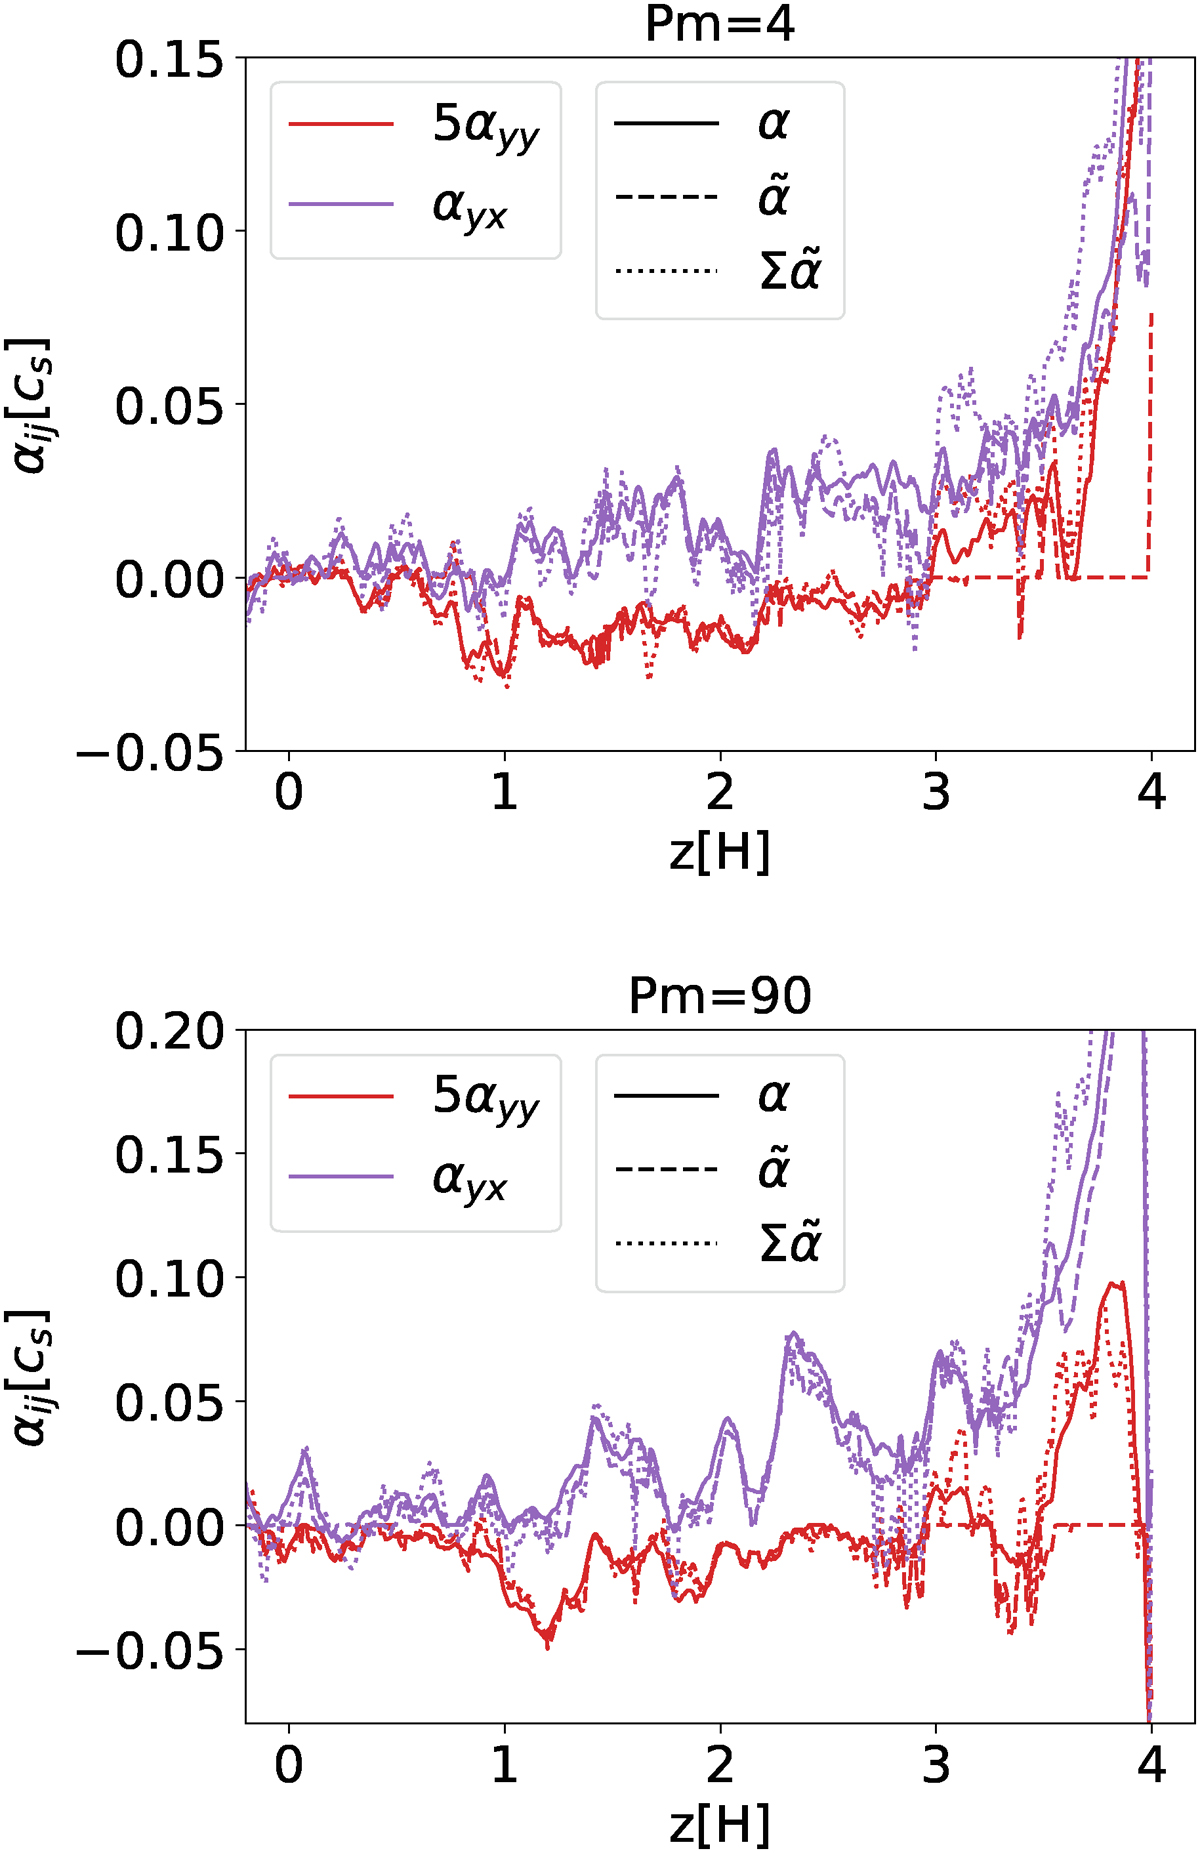
Comparison of the effect of time-lags on the vertical profiles of α dynamo coefficients for Pm = 4 (top) and Pm = 90 (bottom). The purple curves correspond to the αyx component, and the red curves to αyy (compensated by a factor of five to make the coefficients easier to compare). Solid lines correspond to the coefficients α computed using the standard IROS method. dashed lines correspond to the instantaneous dynamo coefficients ![]() (i.e., with a time lag of t′=0) using a modified IROS method in which we take into account the time-lag (see text). Finally, dotted lines correspond to the sum of the new coefficients calculated using the modified IROS method from four successive snapshots, namely,
(i.e., with a time lag of t′=0) using a modified IROS method in which we take into account the time-lag (see text). Finally, dotted lines correspond to the sum of the new coefficients calculated using the modified IROS method from four successive snapshots, namely,  .
.
Current usage metrics show cumulative count of Article Views (full-text article views including HTML views, PDF and ePub downloads, according to the available data) and Abstracts Views on Vision4Press platform.
Data correspond to usage on the plateform after 2015. The current usage metrics is available 48-96 hours after online publication and is updated daily on week days.
Initial download of the metrics may take a while.