Open Access
Fig. 4
Download original image
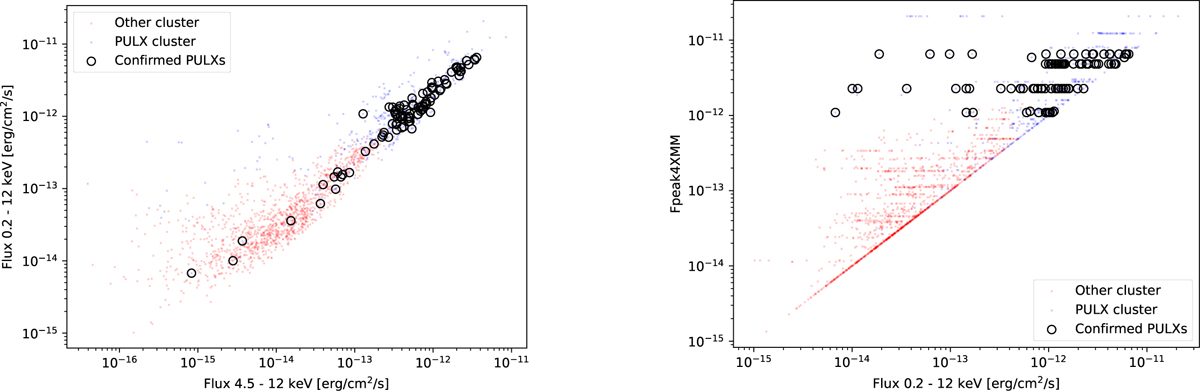
2D representations of the two clusters considering two pairs of parameters. The blue dots are the observations belonging to the CP cluster, red dots are those belonging to the CU cluster, and black empty circles flag the known PULXs.
Current usage metrics show cumulative count of Article Views (full-text article views including HTML views, PDF and ePub downloads, according to the available data) and Abstracts Views on Vision4Press platform.
Data correspond to usage on the plateform after 2015. The current usage metrics is available 48-96 hours after online publication and is updated daily on week days.
Initial download of the metrics may take a while.