Open Access
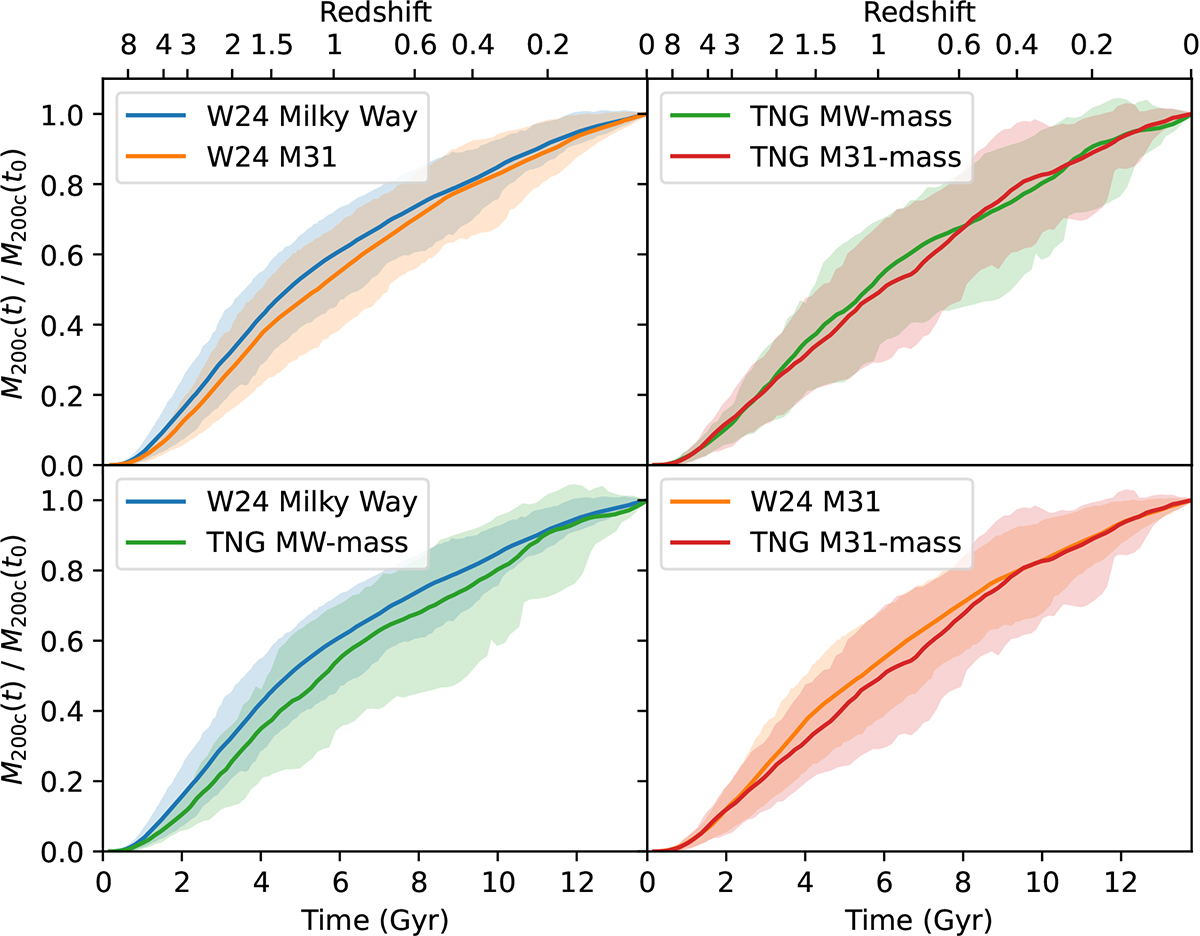
Fig. 1.
Download original image
Comparison of the mass growth histories of the MW and M31 galaxies from the constrained simulations of W24, compared to random MW- or M31-mass galaxies from TNG50-DMO. The central lines are the means, and shading indicates the 16–84 percentile regions. The un-normalised mass growth histories are shown in Appendix C.
Current usage metrics show cumulative count of Article Views (full-text article views including HTML views, PDF and ePub downloads, according to the available data) and Abstracts Views on Vision4Press platform.
Data correspond to usage on the plateform after 2015. The current usage metrics is available 48-96 hours after online publication and is updated daily on week days.
Initial download of the metrics may take a while.