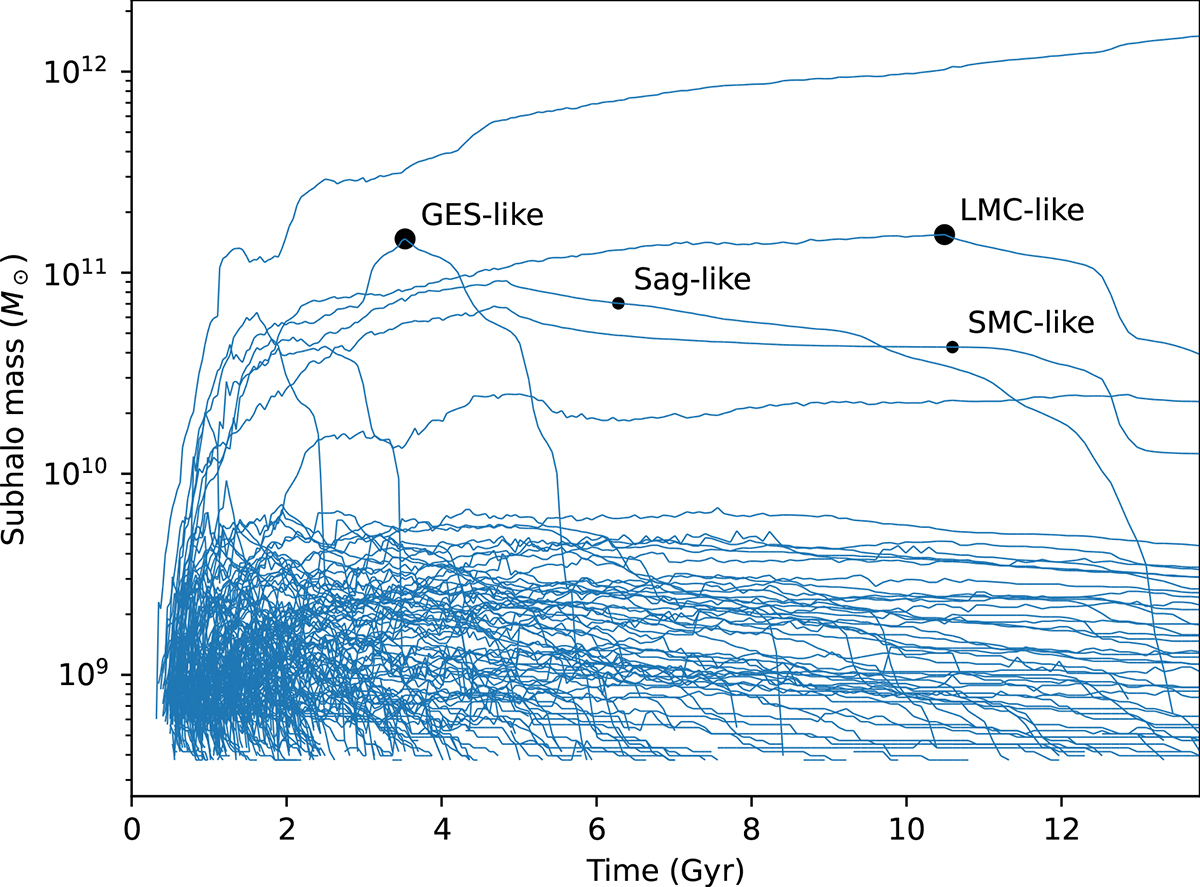
Fig. 4.
Download original image
Example of the mass growth history of all the sub-haloes that end up in the MW’s FoF group. The top curve corresponds to the main progenitor of the MW. This particular simulation (C10 S910 in the notation of W24) has both a GES and an LMC analogue, which are indicated with the large black circles. A video of this particular simulation is available online.
Current usage metrics show cumulative count of Article Views (full-text article views including HTML views, PDF and ePub downloads, according to the available data) and Abstracts Views on Vision4Press platform.
Data correspond to usage on the plateform after 2015. The current usage metrics is available 48-96 hours after online publication and is updated daily on week days.
Initial download of the metrics may take a while.